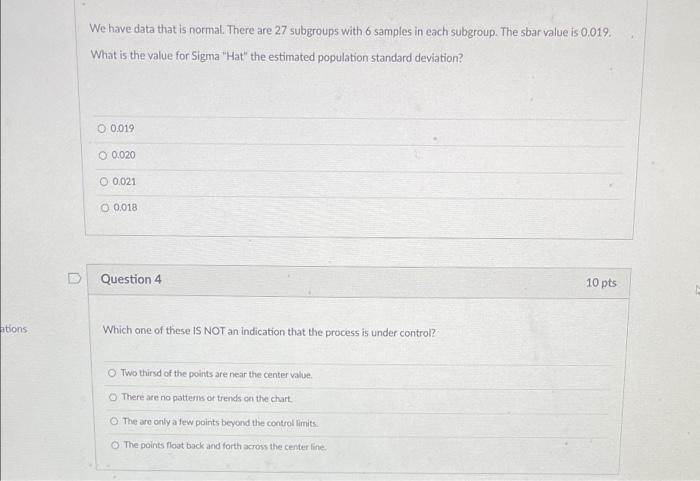
Question: We have data that is normal. There are 27 subgroups with 6 samples in each subgroup. The sbar value is 0.019. What is the value

We have data that is normal. There are 27
We have data that is normal. There are 27 subgroups with 6 samples in each subgroup. The sbar value is 0.019. What is the value for Sigma "Hat" the estimated population standard deviation? 0.019 0.020 O 0.021 0.018 Question 4 10 pts ations Which one of these IS NOT an indication that the process is under control? Two third of the points are near the center value, There are no patterns or trends on the chart The are only a few points beyond the control limits The points float back and forth across the center line

Step by Step Solution

There are 3 Steps involved in it

1 Expert Approved Answer
Step: 1 Unlock blur-text-image
Question Has Been Solved by an Expert!

Get step-by-step solutions from verified subject matter experts

Step: 2 Unlock
Step: 3 Unlock

Students Have Also Explored These Related General Management Questions!