

Question: We have data that is normal. There are 27 subgroups with 6 samples in each subgroup. The sbar value is 0.019. What is the
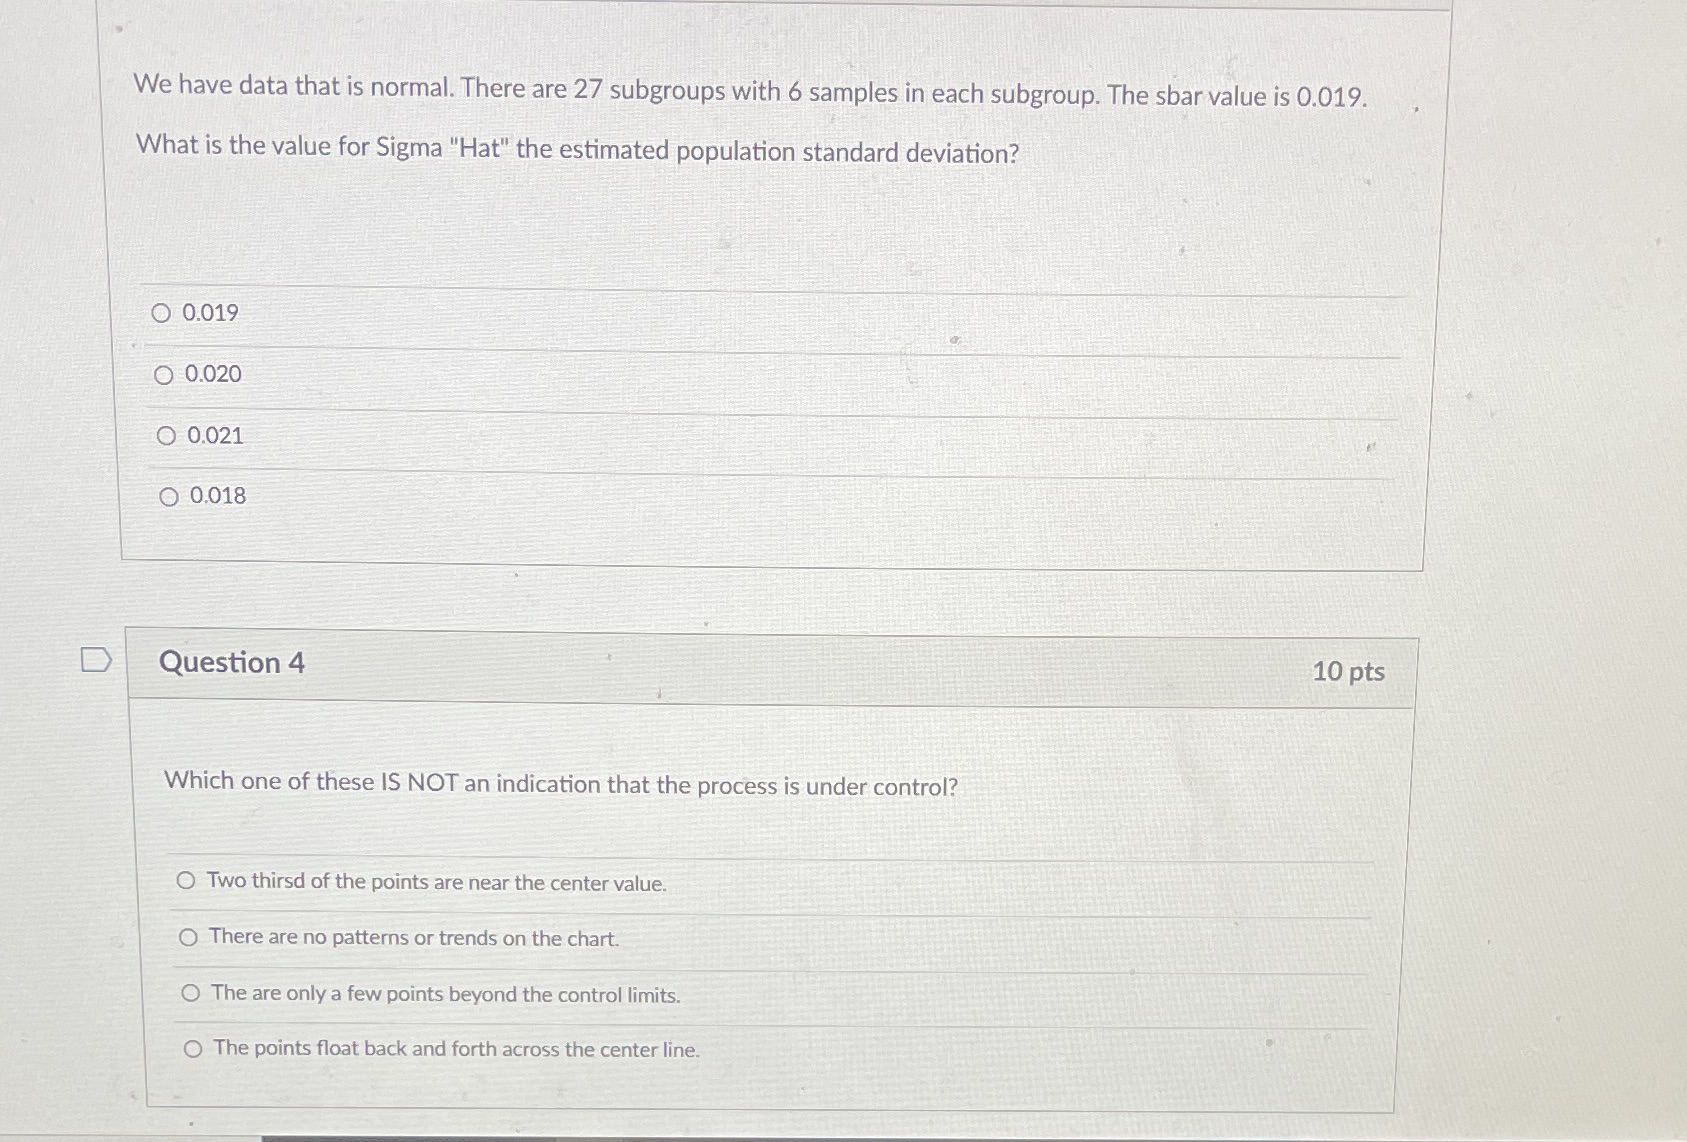
We have data that is normal. There are 27 subgroups with 6 samples in each subgroup. The sbar value is 0.019. What is the value for Sigma "Hat" the estimated population standard deviation? O 0.019 O 0.020 O 0.021 0.018 Question 4 Which one of these IS NOT an indication that the process is under control? O Two thirsd of the points are near the center value. O There are no patterns or trends on the chart. O The are only a few points beyond the control limits. O The points float back and forth across the center line. 10 pts
Step by Step Solution
There are 3 Steps involved in it
1 Expert Approved Answer
Step: 1 Unlock

Question Has Been Solved by an Expert!
Get step-by-step solutions from verified subject matter experts
Step: 2 Unlock
Step: 3 Unlock