

Question: We have to use a low pass filter .... Also the file mentioned above * that needed to be extracted is a MATLAB code that
We have to use a low pass filter .... Also the file mentioned above * that needed to be extracted is a MATLAB code that u have to write your code on it * you'll find the code below ..... Also i do acknowledge that policy which say that I'm only allowed to post one question per time but the thing is all of the parts are needed in order to build the final code so its actually a one question with multiple requirements for the code..... & please ASAP
the code u need to start write after it :
****** clear all; close all; load 'HW2.mat';
%% Inputs % Original_Signal: The signal before adding noise % Noisy_Signal: The signal with noise % L: The length of the signal % Time: the time axis
%% Plot the signal and the noisy signal in one figure figure subplot(2,1,1) plot(Time, Original_Signal); xlabel('Time'); ylabel('Amplitude') title('Original Signal') subplot(2,1,2) plot(Time, Noisy_Signal) title('Noisy Signal') xlabel('Time'); ylabel('Amplitude')
%% Define the filter fc = 500; % cutoff frequency
% Design the filter using the window method (just use it as is) Fs = 8000; x = (-(L-1)/2:(L-1)/2); hideal = sinc(2*x*fc/Fs); h = hamming(L)' .* hideal; % h is our filter h = h'; h = h/sum(h);
%% Plot the impulse response h figure plot(Time,h) xlabel('Time'); ylabel('Amplitude') title('The impulse response h(t)')
%% Start you code here *******
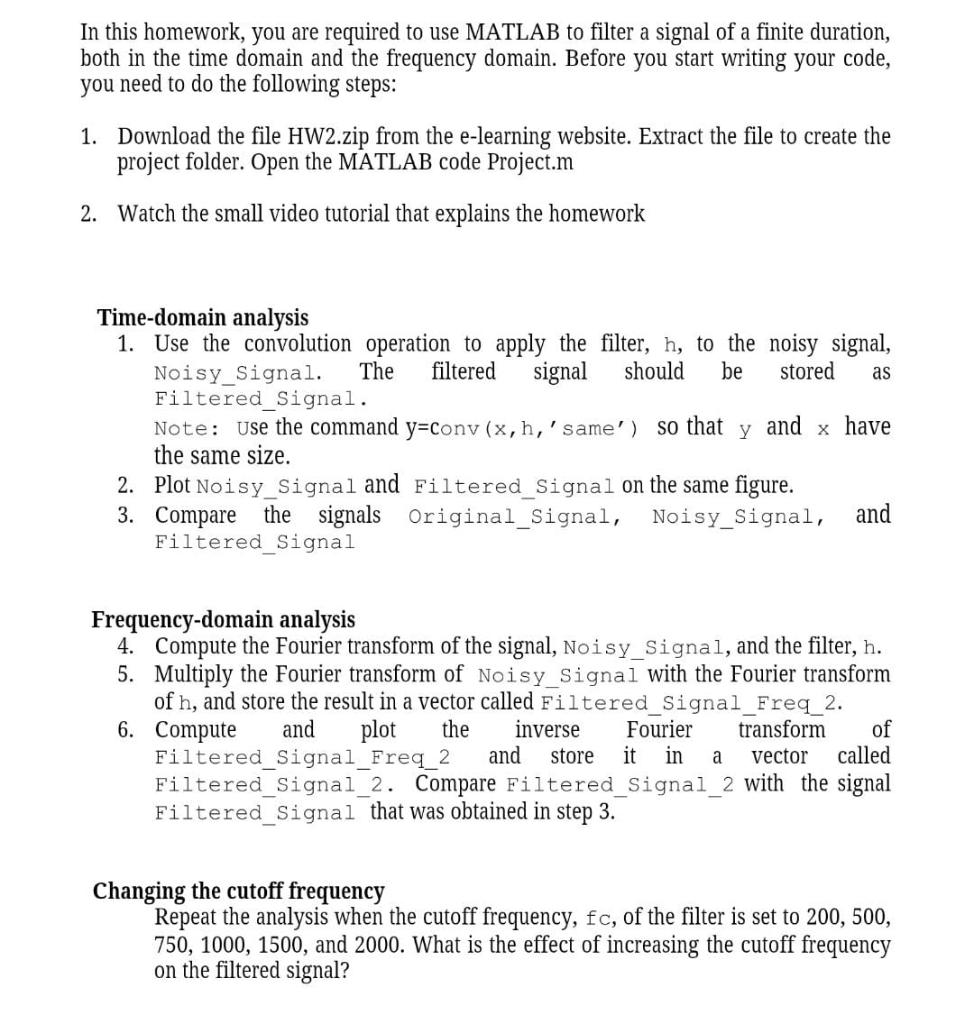
In this homework, you are required to use MATLAB to filter a signal of a finite duration, both in the time domain and the frequency domain. Before you start writing your code, you need to do the following steps: 1. Download the file HW 2.zip from the e-learning website. Extract the file to create the project folder. Open the MATLAB code Project.m 2. Watch the small video tutorial that explains the homework as Time-domain analysis 1. Use the convolution operation to apply the filter, h, to the noisy signal, Noisy_Signal. The filtered signal should be stored Filtered_Signal. Note: Use the command y=conv (x,h,'same') y and x have the same size. 2. Plot Noisy Signal and Filtered_Signal on the same figure. 3. Compare the signals Original_Signal, Noisy_Signal, and Filtered Signal so that Frequency-domain analysis 4. Compute the Fourier transform of the signal, Noisy_Signal, and the filter, h. 5. Multiply the Fourier transform of Noisy_Signal with the Fourier transform of h, and store the result in a vector called Filtered Signal Freq_2. 6. Compute and plot the inverse Fourier transform of Filtered_Signal_Freq_2 and store it in vector called Filtered_Signal_2. Compare Filtered_Signal_2 with the signal Filtered_Signal that was obtained in step 3. Changing the cutoff frequency Repeat the analysis when the cutoff frequency, fc, of the filter is set to 200, 500, 750, 1000, 1500, and 2000. What is the effect of increasing the cutoff frequency on the filtered signal? In this homework, you are required to use MATLAB to filter a signal of a finite duration, both in the time domain and the frequency domain. Before you start writing your code, you need to do the following steps: 1. Download the file HW 2.zip from the e-learning website. Extract the file to create the project folder. Open the MATLAB code Project.m 2. Watch the small video tutorial that explains the homework as Time-domain analysis 1. Use the convolution operation to apply the filter, h, to the noisy signal, Noisy_Signal. The filtered signal should be stored Filtered_Signal. Note: Use the command y=conv (x,h,'same') y and x have the same size. 2. Plot Noisy Signal and Filtered_Signal on the same figure. 3. Compare the signals Original_Signal, Noisy_Signal, and Filtered Signal so that Frequency-domain analysis 4. Compute the Fourier transform of the signal, Noisy_Signal, and the filter, h. 5. Multiply the Fourier transform of Noisy_Signal with the Fourier transform of h, and store the result in a vector called Filtered Signal Freq_2. 6. Compute and plot the inverse Fourier transform of Filtered_Signal_Freq_2 and store it in vector called Filtered_Signal_2. Compare Filtered_Signal_2 with the signal Filtered_Signal that was obtained in step 3. Changing the cutoff frequency Repeat the analysis when the cutoff frequency, fc, of the filter is set to 200, 500, 750, 1000, 1500, and 2000. What is the effect of increasing the cutoff frequency on the filtered signal
Step by Step Solution
There are 3 Steps involved in it

Get step-by-step solutions from verified subject matter experts