

Question: we need to plot e(t) in MATLAB. in order to find plot e(t), we have to use the equation of c(t). c(t) is given in
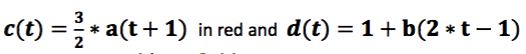
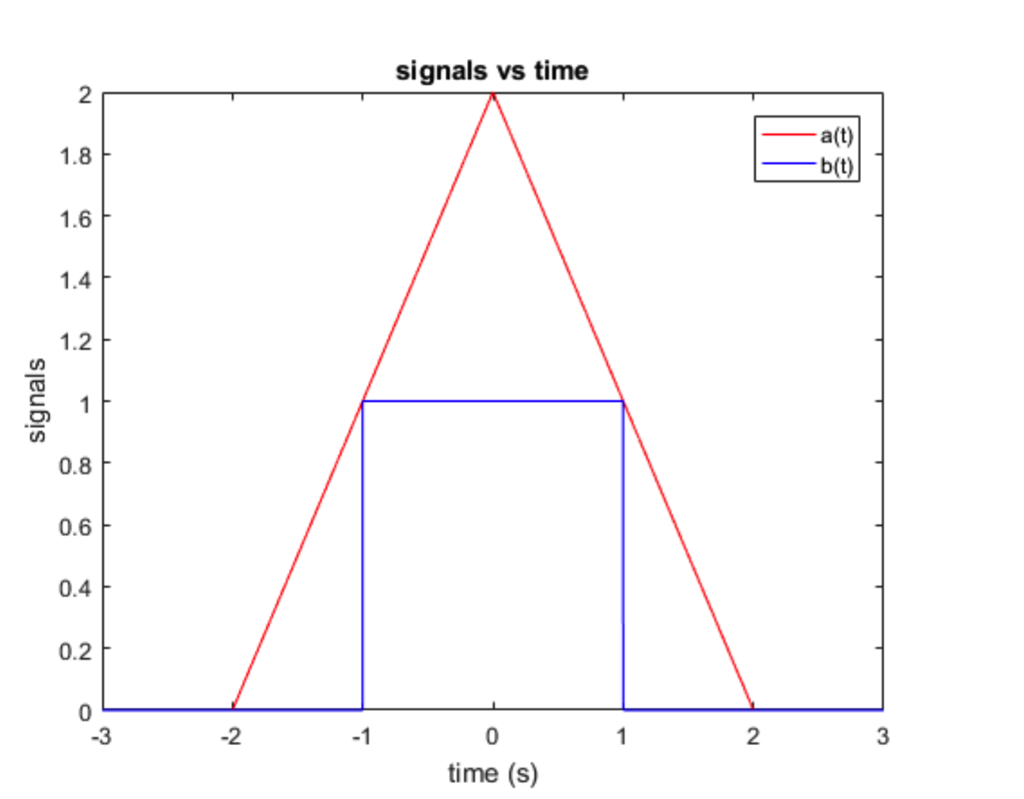
we need to plot e(t) in MATLAB. in order to find plot e(t), we have to use the equation of c(t). c(t) is given in the equation above and it depends on a(t). a(t) is the red triangle given in the graph
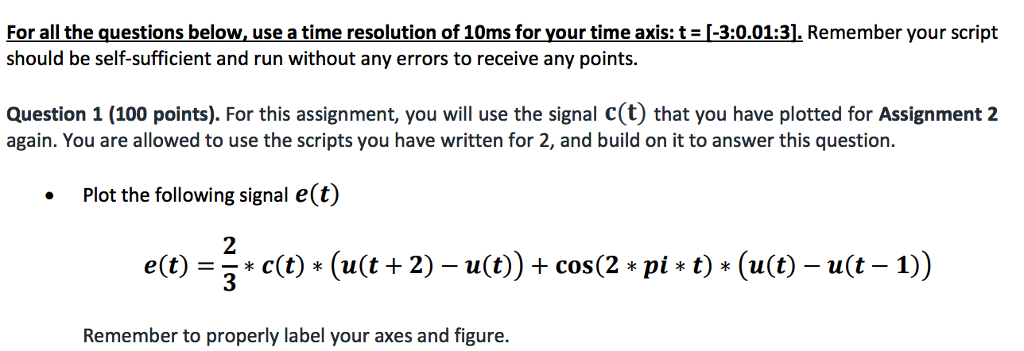
For all the questions below, use a time resolution of 10ms for your time axis: t =-3001:31. Remember your script should be self-sufficient and run without any errors to receive any points. Question 1 (100 points). For this assignment, you will use the signal c(t) that you have plotted for Assignment 2 again. You are allowed to use the scripts you have written for 2, and build on it to answer this question .Plot the following signal e(t) 2 e(t) = * c(t) * (a(t + 2)-u(t)) + cos(2 * pi * t) * (a(t)-u(t-1)) Remember to properly label your axes and figure
Step by Step Solution
There are 3 Steps involved in it

Get step-by-step solutions from verified subject matter experts