

Question: We want to plot the function y x2 over the interval[1,3. In order to do this, we need to establish an x vector (our independent
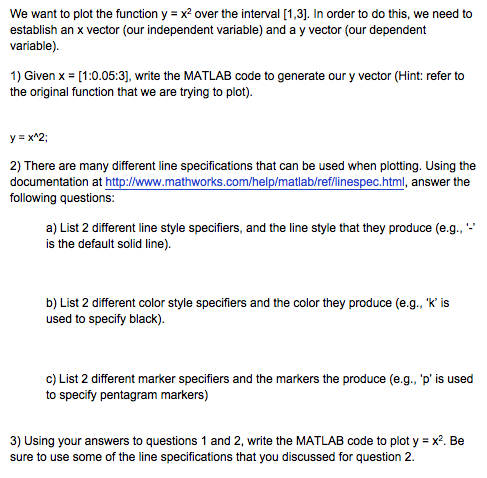
We want to plot the function y x2 over the interval[1,3. In order to do this, we need to establish an x vector (our independent variable) and a y vector (our dependent variable) 1) Given x = [1:0.05:31, write the MATLAB code to generate our y vector (Hint: refer to the original function that we are trying to plot). y = x^2; 2) There are many different line specifications that can be used when plotting. Using the documentation at http:l/www.mathworks.com/help/matlab/ref/linespec.html, answer the following questions: a) List 2 different line style specifiers, and the line style that they produce (e.g., is the default solid line) b) List 2 different color style specifiers and the color they produce (e.g., K is used to specify black). ) List 2 different marker specfiers and the markers the produce (e g. 'p' is used to specify pentagram markers) 3) Using your answers to questions 1 and 2, write the MATLAB code to plot y = sure to use some of the line specifications that you discussed for question 2. Be
Step by Step Solution
There are 3 Steps involved in it

Get step-by-step solutions from verified subject matter experts