

Question: We were assigned this assignment and I have reached a point where I am lost on what to do. The following attachments have the guidelines
We were assigned this assignment and I have reached a point where I am lost on what to do. The following attachments have the guidelines we are supposed to follow for the assignment. I just am a little lost on what to do next.
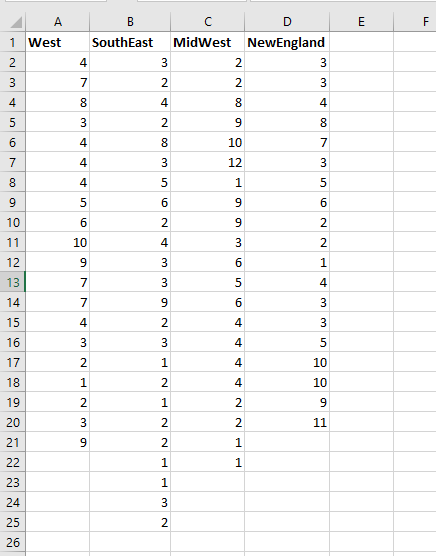
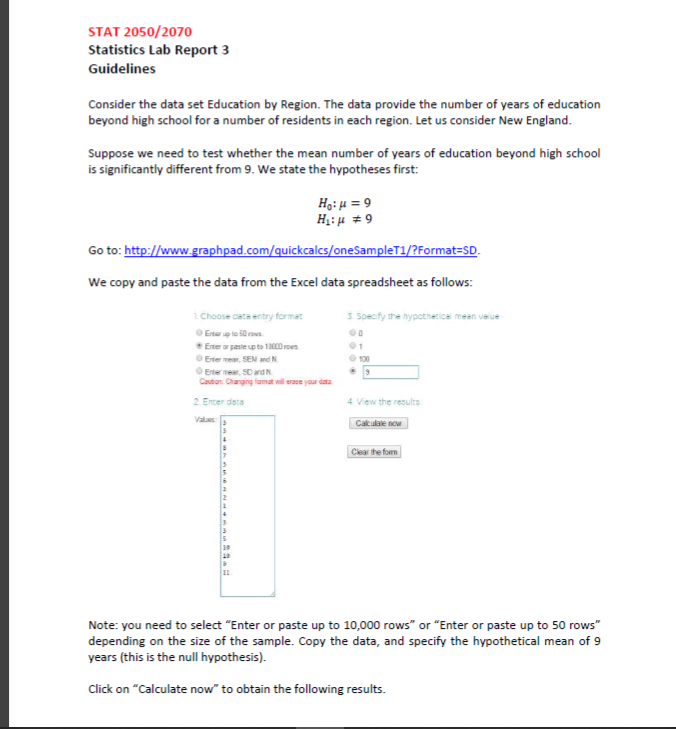
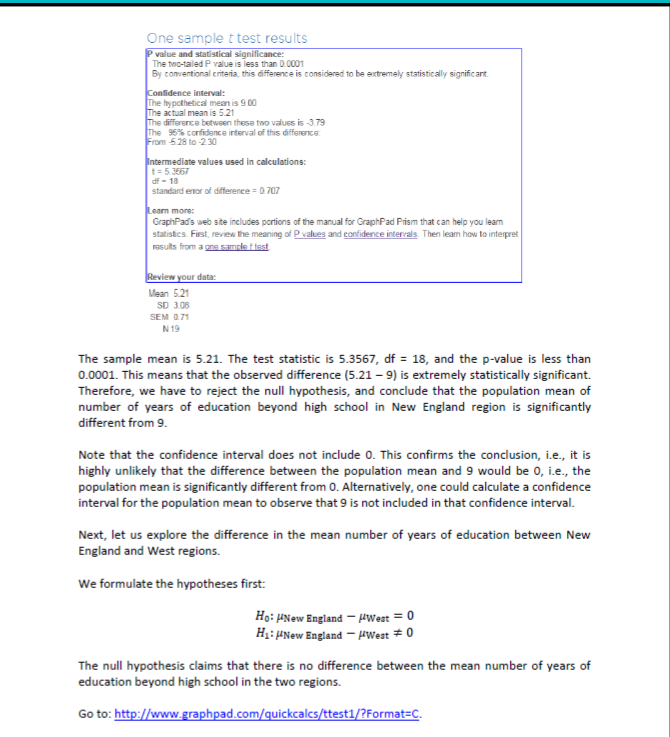
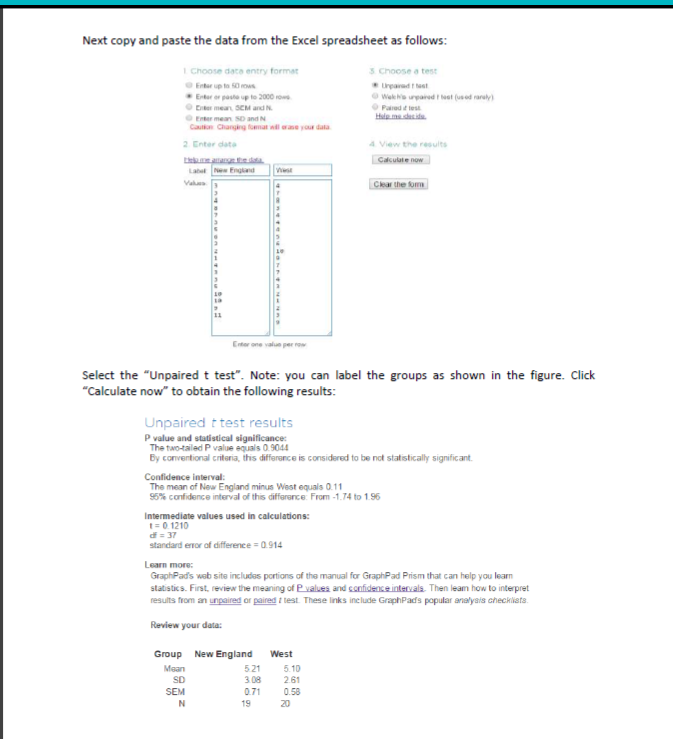
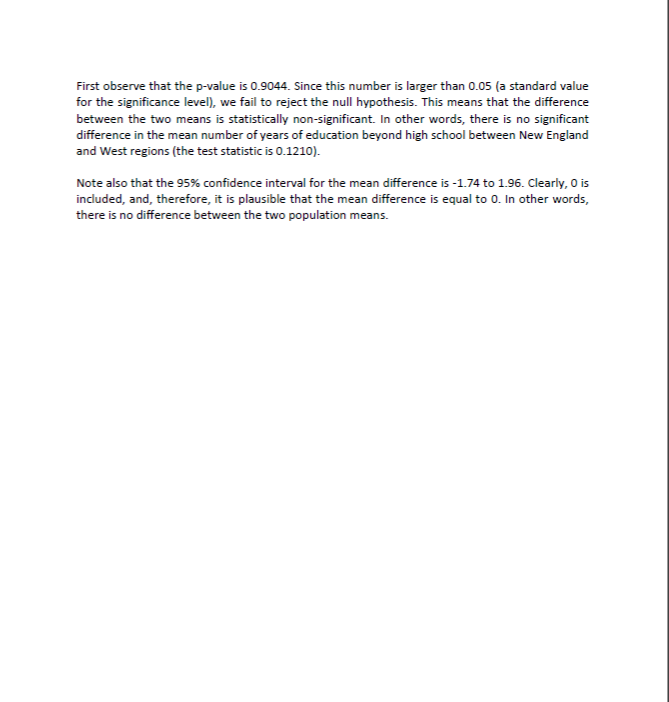
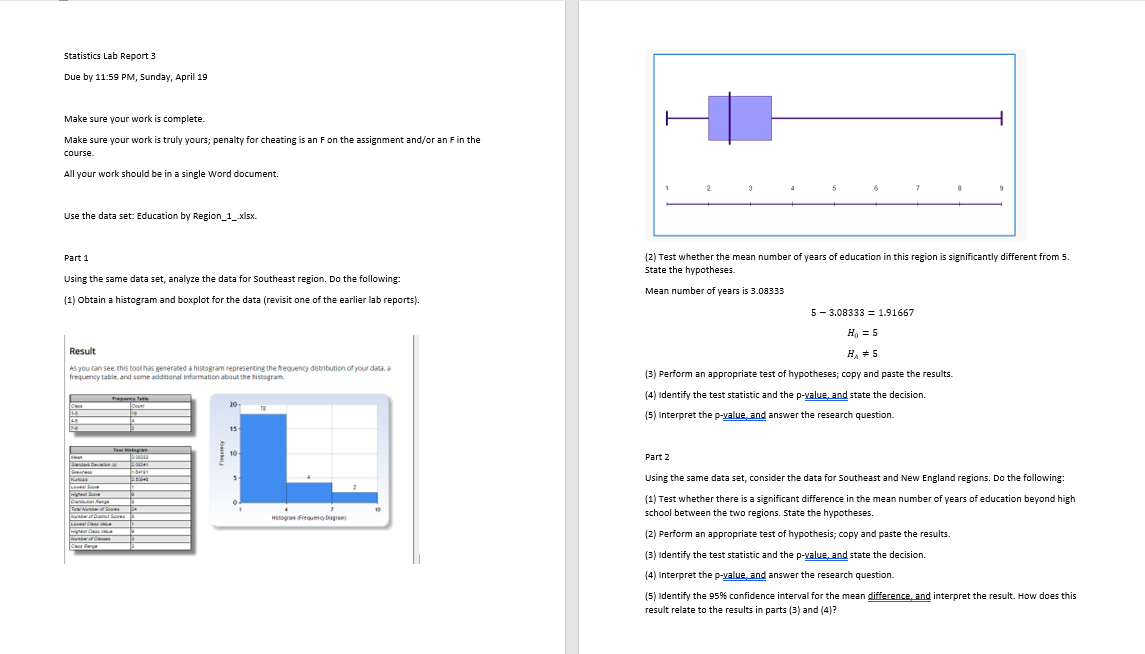
\fSTAT 2050/2070 Statistics Lab Report 3 Guidelines Consider the data set Education by Region. The data provide the number of years of education beyond high school for a number of residents in each region. Let us consider New England. Suppose we need to test whether the mean number of years of education beyond high school is significantly different from 9. We state the hypotheses first: Ho:H = 9 Go to: http://www.graphpad.com/quickcalcs/oneSampleT1/?Format=SD We copy and paste the data from the Excel data spreadsheet as follows: 1 Choose data entry format 3. Specify the hypothetical mean value @ Enter up to 50 rows Enter or panic up to 10000 moms O Enter mem, SEM and N. Entermen, 50 ard N. 2 Enter data 4 View the results Calculate now Clear the for Note: you need to select "Enter or paste up to 10,000 rows" or "Enter or paste up to 50 rows" depending on the size of the sample. Copy the data, and specify the hypothetical mean of 9 years (this is the null hypothesis). Click on "Calculate now" to obtain the following results.One sample t test results P value and statistical significance: The two-tailed P value is less than 010001 By conventional criteria, this difference is considered to be extremely statistically significant. Confidence interval: The hypothetical mean is 9.00 The actual mean is 5.21 The difference between these two values is -3.79 The 95% confidence interval of this differences From -528 to-230 Intermediate values used in calculations: 1 = 5.3567 df - 18 standard error of difference = 0.707 Learn more: GraphPad's web site includes portions of the manual for GraphPad Prism that can help you learn statistics. First, review the meaning of P values and confidence intervals. Then leam how to interpret results from a one sample f test Review your data: Mean 5.21 50 3.06 SEM 071 N19 The sample mean is 5.21. The test statistic is 5.3567, of = 18, and the p-value is less than 0.0001. This means that the observed difference (5.21 - 9) is extremely statistically significant. Therefore, we have to reject the null hypothesis, and conclude that the population mean of number of years of education beyond high school in New England region is significantly different from 9. Note that the confidence interval does not include 0. This confirms the conclusion, i.e., it is highly unlikely that the difference between the population mean and 9 would be 0, i.e., the population mean is significantly different from 0. Alternatively, one could calculate a confidence interval for the population mean to observe that 9 is not included in that confidence interval. Next, let us explore the difference in the mean number of years of education between New England and West regions. We formulate the hypotheses first: Ho: /New England - HWest = 0 H1: /New England - /West # 0 The null hypothesis claims that there is no difference between the mean number of years of education beyond high school in the two regions. Go to: http://www.graphpad.com/quickcalcs/ttest1/?Format=C.Next copy and paste the data from the Excel spreadsheet as follows: I Choose data entry format 3 Choose a test @ Friar up in 50 news Unpaired Fusi Exbar or paste up to 2000 roms 0 Walk's upand I best (used rarely) Erin mean OCM and N. Firmon 50 andN Canion Changing Monnat will gung pou data 2 Enter date A View the results Calculate now Label New England Clear the for Ender one value per row Select the "Unpaired t test". Note: you can label the groups as shown in the figure. Click "Calculate now" to obtain the following results: Unpaired t test results P value and statistical significance: The two-tailed P value equals 0.9044 By conventional criteria, this difference is considered to be not statistically significant. Confidence interval: The mean of New England minus West equals 0.11 95% confidence interval of this difference: From -1.74 to 1.96 Intermediate values used in calculations: 1 = 0.1210 df = 37 standard eror of difference = 0.914 Learn more: GraphPad's web site includes portions of the manual for GraphPad Prism that can help you learn statistics. First. review the meaning of P values and confidence intervals. Then leam how to interpret results from an unpaired or paired / test. These links include GraphPad's popular analysis checklists. Review your data: Group New England West Mean 5 21 5.10 3.08 2.61 SEM 0.71 0.58 19 20First observe that the p-value is 0.9044. Since this number is larger than 0.05 (a standard value for the significance level), we fail to reject the null hypothesis. This means that the difference between the two means is statistically non-significant. In other words, there is no significant difference in the mean number of years of education beyond high school between New England and West regions (the test statistic is 0.1210). Note also that the 95% confidence interval for the mean difference is -1.74 to 1.96. Clearly, 0 is included, and, therefore, it is plausible that the mean difference is equal to 0. In other words, there is no difference between the two population means.Statistics Lab Report 3 Due by 11:59 PM, Sunday, April 19 Make sure your work is complete. Make sure your work is truly yours; penalty for cheating is an F on the assignment and/or an F in the course. All your work should be in a single Word document. Use the data set: Education by Region_1_-xlax. Part 1 (2) Test whether the mean number of years of education in this region is significantly different from 5. Using the same data set, analyze the data for Southeast region. Do the following: state the hypotheses (1) obtain a histogram and boxplot for the data (revisit one of the earlier lab reports). Mean number of years is 3.08333 5 -3.08333 = 1.91667 Ho = 5 Result H # 5 As you can see this cool has generated a histogram representing the frequency distribution of your dana. a frequency table, and some addtional information about the histagram (3) Perform an appropriate test of hypotheses; copy and paste the results. [4) Identify the test statistic and the p-value, and state the decision. 20 18 [5) Interpret the p-value, and answer the research question. Part 2 Using the same data set, consider the data for Southeast and New England regions. Do the following: (1) Test whether there is a significant difference in the mean number of years of education beyond high 7 school between the two regions. State the hypotheses. (2) perform an appropriate test of hypothesis; copy and paste the results. (3) identify the test statistic and the p-value, and state the decision. (4) Interpret the p-value, and answer the research question. 5) Identify the 95% confidence interval for the mean difference, and interpret the result. How does this result relate to the results in parts (3) and (4]
Step by Step Solution
There are 3 Steps involved in it

Get step-by-step solutions from verified subject matter experts