

Question: We will now use your working Collatz code to create a plot like this one on Wikipedia: CollatzPlot Create an array of integers from 1
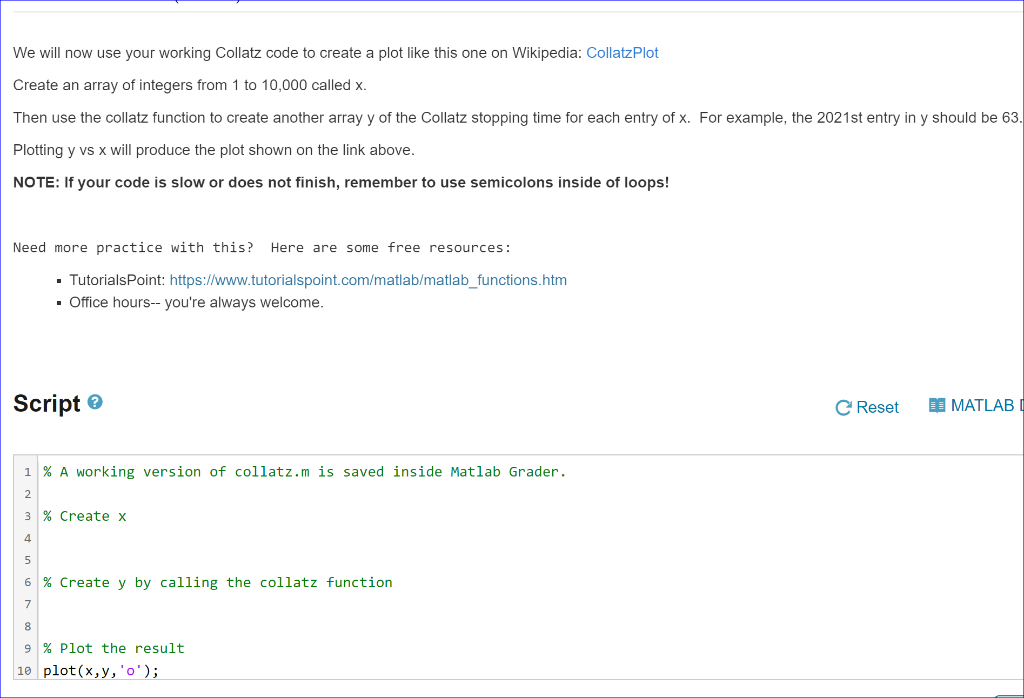
We will now use your working Collatz code to create a plot like this one on Wikipedia: CollatzPlot Create an array of integers from 1 to 10,000 called x. Then use the collatz function to create another array y of the Collatz stopping time for each entry of x. For example, the 2021 st entry in y should be 63 . Plotting y vs x will produce the plot shown on the link above. NOTE: If your code is slow or does not finish, remember to use semicolons inside of loops! Need more practice with this? Here are some free resources: - TutorialsPoint: https://www.tutorialspoint.com/matlab/matlab_functions.htm - Office hours-- you're always welcome. Script 3 \begin{tabular}{|l|l|} 1 & % A working version of collatz.m is saved inside Matlab Grader. \\ 2 & % Create x \\ 4 & \\ 5 & \\ 6 & % Create y by calling the collatz function \\ 7 & \\ 8 & \\ 9 & %Plot the result \\ 10 & plot(x,y,0); \end{tabular}
Step by Step Solution
There are 3 Steps involved in it

Get step-by-step solutions from verified subject matter experts