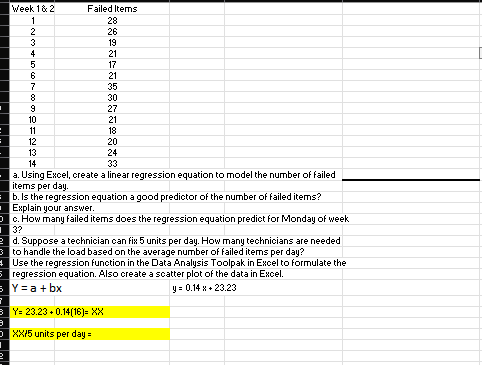
Question: = Week 1 & 2 1 2 3+56N0S=22: 2 4 7 8 9 10 11 12 13 14 Failed Items 28 26 19 21 17

= Week 1 & 2 1 2 3+56N0S=22: 2 4 7 8 9 10 11 12

= Week 1 & 2 1 2 3+56N0S=22: 2 4 7 8 9 10 11 12 13 14 Failed Items 28 26 19 21 17 21 35 30 27 21 18 20 24 33 a. Using Excel, create a linear regression equation to model the number of failed items per day. b. Is the regression equation a good predictor of the number of failed items? Explain your answer. c. How many failed items does the regression equation predict for Monday of week 3? d. Suppose a technician can fix 5 units per day. How many technicians are needed to handle the load based on the average number of failed items per day? Use the regression function in the Data Analysis Toolpak in Excel to formulate the regression equation. Also create a scatter plot of the data in Excel. 5 Y= a + bx y= 0.14 x 23.23 8 Y= 23.23 +0.14(16)= XX XX/5 units per day =

Step by Step Solution

There are 3 Steps involved in it

1 Expert Approved Answer
Step: 1 Unlock blur-text-image
Question Has Been Solved by an Expert!

Get step-by-step solutions from verified subject matter experts

Step: 2 Unlock
Step: 3 Unlock

Students Have Also Explored These Related General Management Questions!