

SOLVE WITH MATLAB AND PROVIDE THE CODE Plot the surface of a function , when 2
Fantastic news! We've Found the answer you've been seeking!
Question:
SOLVE WITH MATLAB AND PROVIDE THE CODE
Plot the surface of a function ![]() , when −2 ≤ x ≤ 2 and −2 ≤ y ≤ 2. Find the rate of change of the function direction of x-axis and y-axis at the point (0.6, -1.2) by using the central difference method
, when −2 ≤ x ≤ 2 and −2 ≤ y ≤ 2. Find the rate of change of the function direction of x-axis and y-axis at the point (0.6, -1.2) by using the central difference method 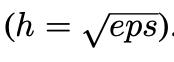
Expert Answer:
Consider the ordered pair function in x y fxig 3x 5752 40 2h 2 y 2 240 Point 0612 f ... View the full answer

Related Book For 

Posted Date:
