

Question: what can you conclude from this R chart? options are : the process is getting faster, the process is in control, the process is capable,
what can you conclude from this R chart?
R Chart for samples --UCL 0.04 Group summary statistics AL CL 0.02 HLCL 0.00 15 18 21 24 24 27 30 33 1 3 5 7 9 12 Group options are : the process is getting faster, the process is in control, the process is capable, the process is getting more consistent 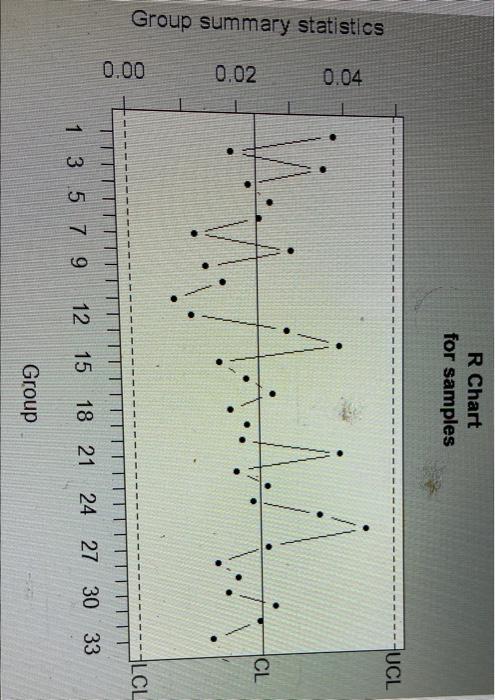
Step by Step Solution
There are 3 Steps involved in it
1 Expert Approved Answer
Step: 1 Unlock

Question Has Been Solved by an Expert!
Get step-by-step solutions from verified subject matter experts
Step: 2 Unlock
Step: 3 Unlock