

Question: What does the graph of the parametric equations x (t) = 3 - t and y (t) = (t + 1) , where t is
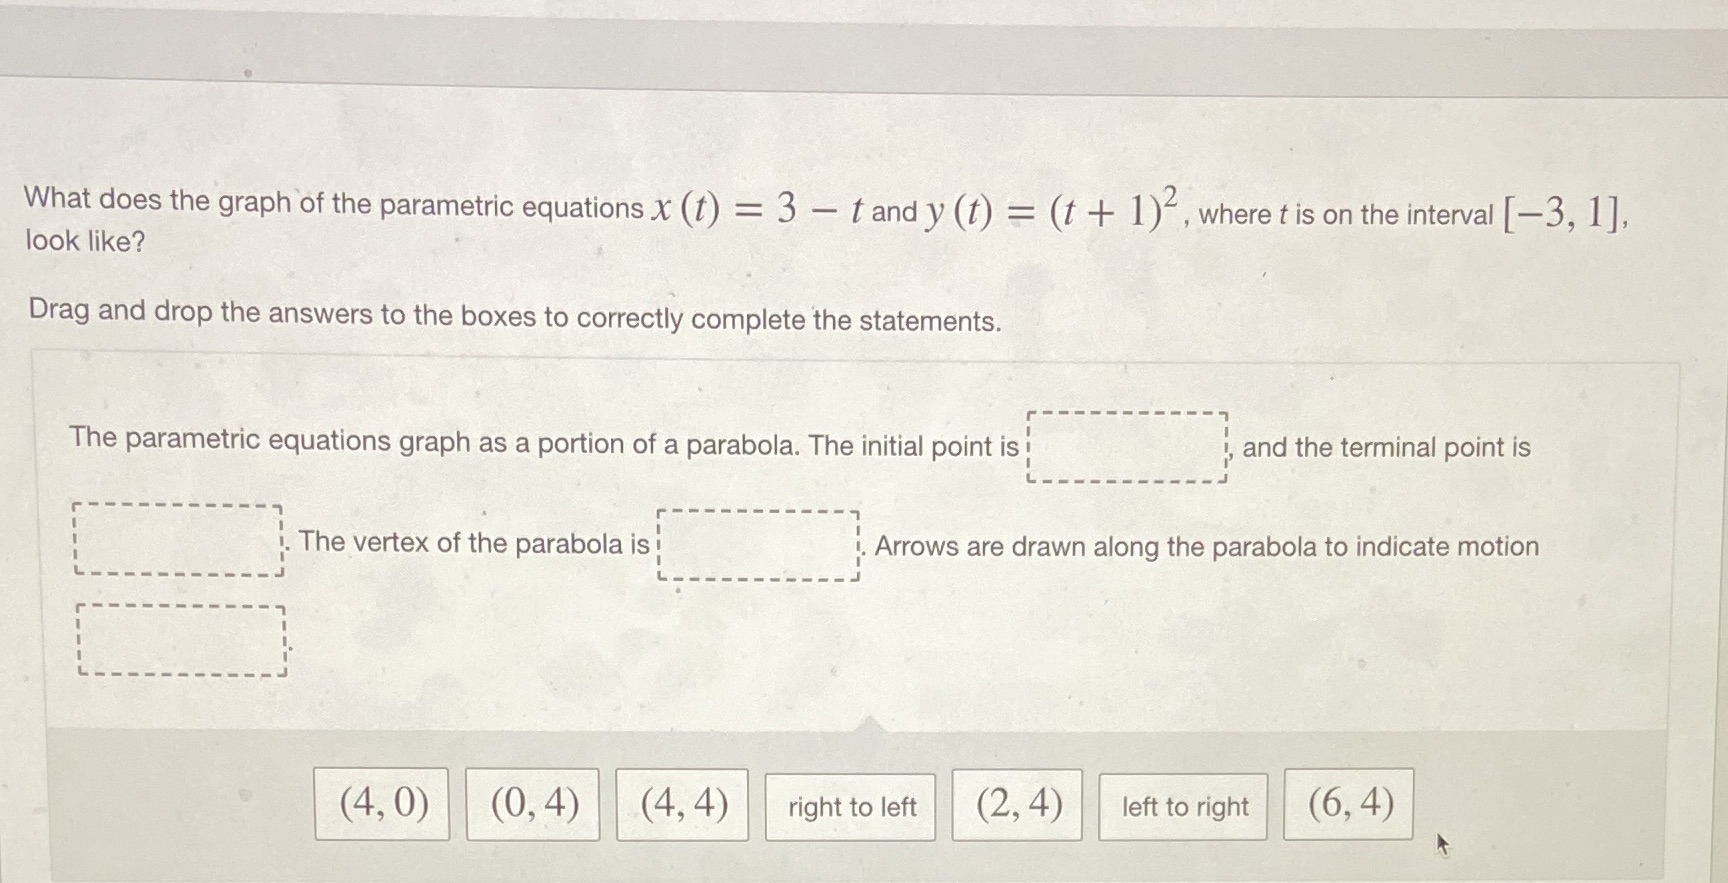
What does the graph of the parametric equations x (t) = 3 - t and y (t) = (t + 1) , where t is on the interval [-3, 1], look like? Drag and drop the answers to the boxes to correctly complete the statements. The parametric equations graph as a portion of a parabola. The initial point is and the terminal point is The vertex of the parabola is Arrows are drawn along the parabola to indicate motion (4, 0) (0, 4) ( 4, 4) right to left (2, 4) left to right (6, 4)
Step by Step Solution
There are 3 Steps involved in it
1 Expert Approved Answer
Step: 1 Unlock

Question Has Been Solved by an Expert!
Get step-by-step solutions from verified subject matter experts
Step: 2 Unlock
Step: 3 Unlock