

Question: What does the short-run graph illustrate? a.variable cost increasing with output b.total cost decreasing with output c.spreading the overhead d.increasing returns to scale Chrome File

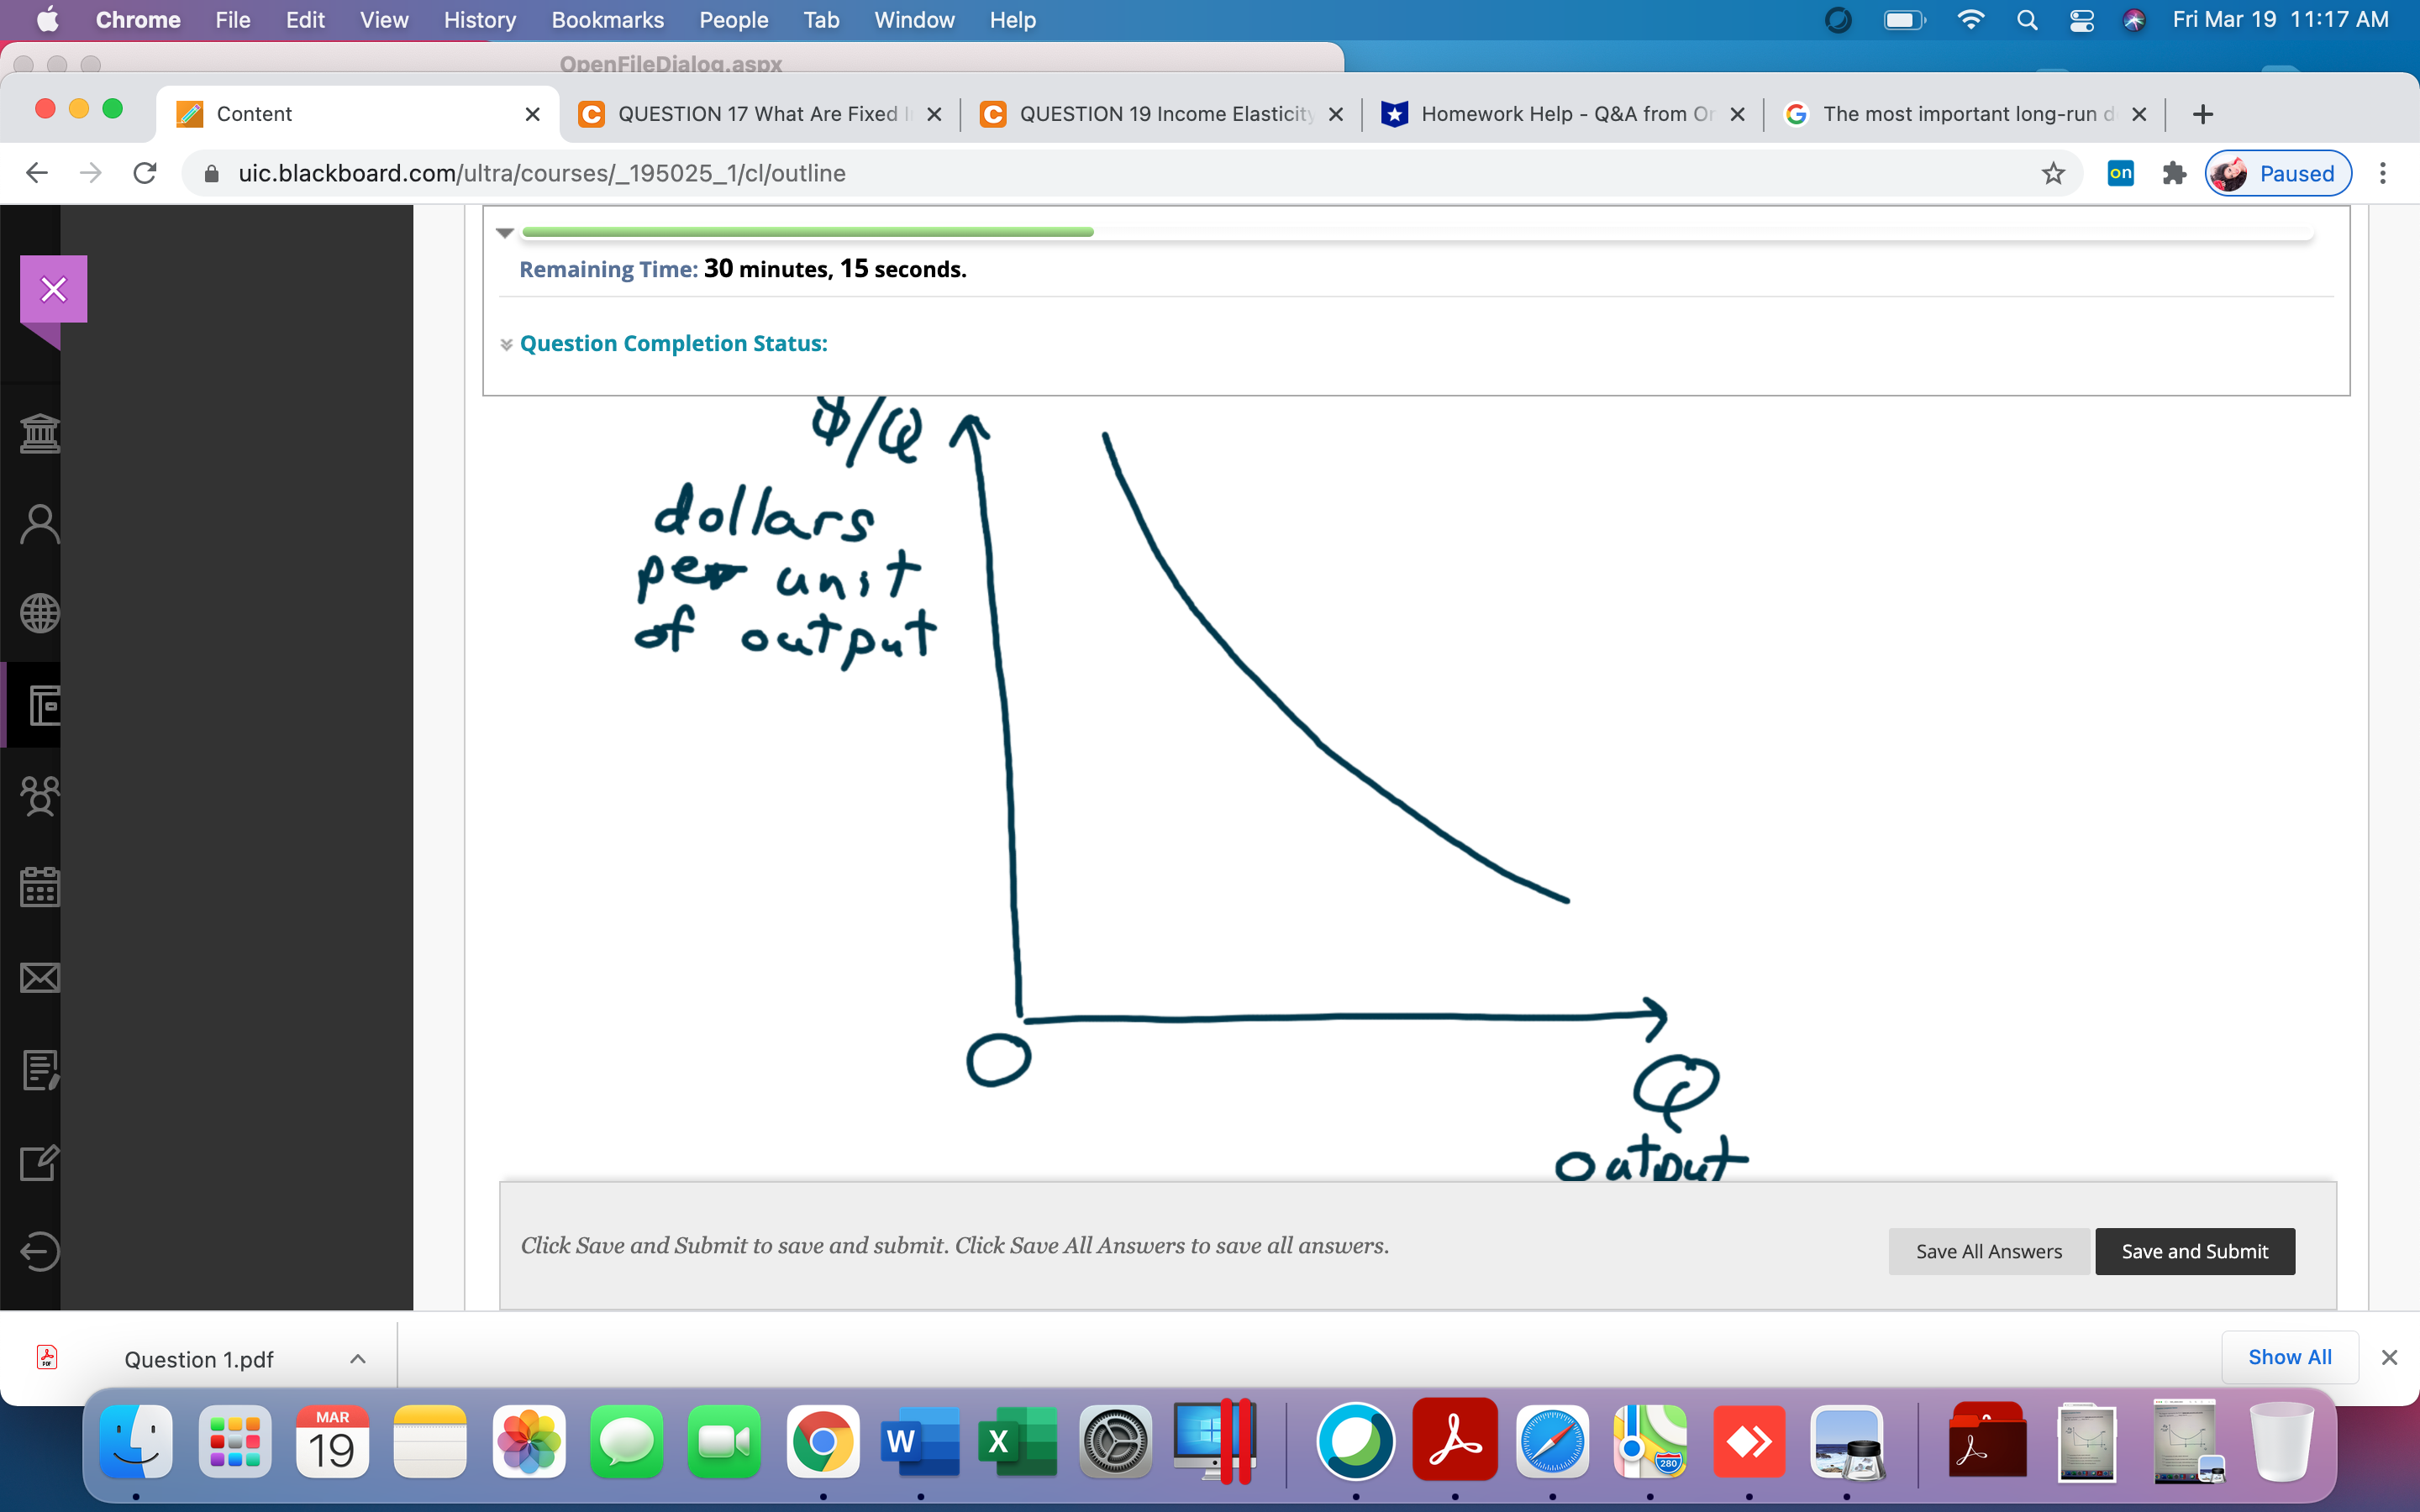
What does theshort-rungraph illustrate?
a.variable cost increasing with output
b.total cost decreasing with output
c.spreading the overhead
d.increasing returns to scale
Chrome File Edit View History Bookmarks People Tab Window Help Q 8 Fri Mar 19 11:17 AM OpenFileDialoa.aspx ... Content X C QUESTION 17 What Are Fixed | X C QUESTION 19 Income Elasticity X Homework Help - Q&A from Or X G The most important long-run d X + C Auic.blackboard.com/ultra/courses/_195025_1/cl/outline on # Paused Remaining Time: 30 minutes, 15 seconds. X Question Completion Status: 8 dollars per unit of output X O outout Click Save and Submit to save and submit. Click Save All Answers to save all answers. Save All Answers Save and Submit Question 1.pdf Show All X MAR 19 W X
Step by Step Solution
There are 3 Steps involved in it

Get step-by-step solutions from verified subject matter experts