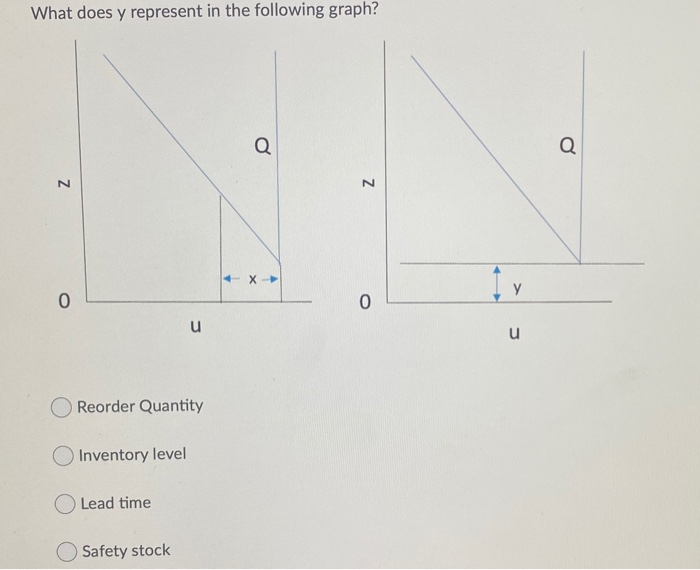
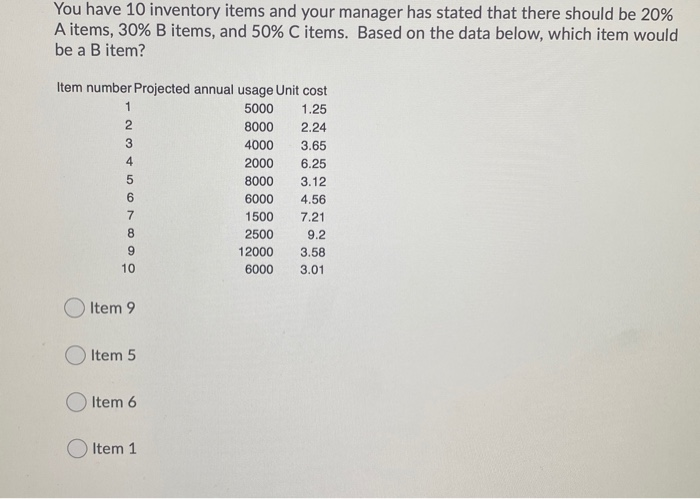
Question: What does y represent in the following graph? Q Q N N X 0 0 u u O Reorder Quantity Inventory level Lead time Safety

What does y represent in the following graph? Q Q
What does y represent in the following graph? Q Q N N X 0 0 u u O Reorder Quantity Inventory level Lead time Safety stock You have 10 inventory items and your manager has stated that there should be 20% A items, 30% B items, and 50% C items. Based on the data below, which item would be a B item? Item number Projected annual usage Unit cost 1 5000 1.25 2 8000 2.24 3 4000 3.65 4 2000 6.25 5 8000 3.12 6 6000 4.56 7 1500 7.21 8 2500 9.2 9 12000 3.58 10 6000 3.01 Item 9 Item 5 Item 6 Item 1

Step by Step Solution

There are 3 Steps involved in it

1 Expert Approved Answer
Step: 1 Unlock blur-text-image
Question Has Been Solved by an Expert!

Get step-by-step solutions from verified subject matter experts

Step: 2 Unlock
Step: 3 Unlock

Students Have Also Explored These Related General Management Questions!