

Question: What financial performance issues do you see at Under Armour based on the data in case Exhibits 1, 2, and 3? EXHIBIT 2 Selected Financial
What financial performance issues do you see at Under Armour based on the data in case Exhibits 1, 2, and 3?
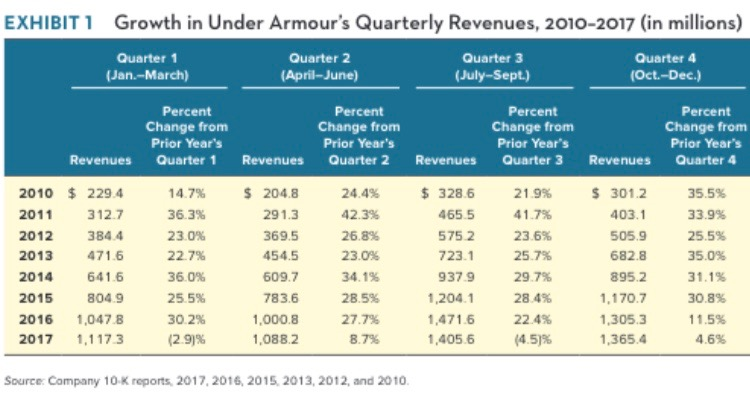
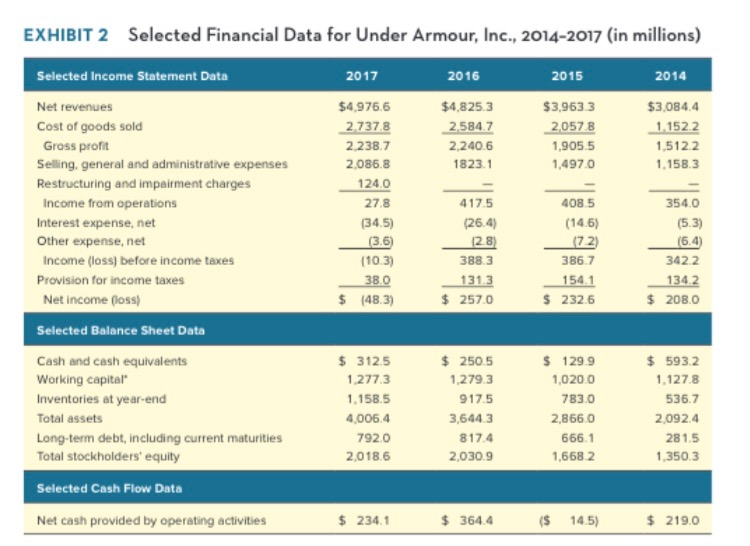
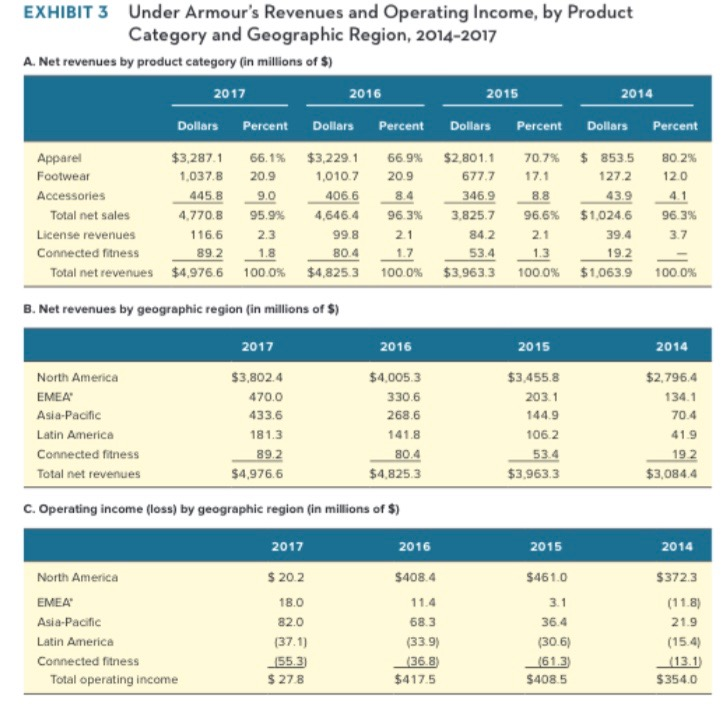
EXHIBIT 2 Selected Financial Data for Under Armour, Inc., 2014-2017 (in millions) 2014 Selected Income Statement Data Net revenues Cost of goods sold 2017 2016 2015 4,976.6 2 737.8 2.238.7 2,086.8 24.0 27.8 $4,825.3 2584.7 2,240.6 1823.1 $3,963.3 2057 8 ,905.5 1,497.0 $3,084.4 Gross proft Selling. general and administrative expenses Restructuring and impairment charges 1.152 2 1512.2 1.158.3 408.5 (14.6) (72) 386.7 1313154.1 $ 232.6 417.5 (26.4) 28 388.3 354.0 (5.3) (6.4) 342.2 1342 $ 208.0 Income from operations Interest expense, net Other expense, net 34 (3.6) (10.3) Income (loss) before income taxes Provision for income taxes 38.0 Net income (loss) $ (48.3) $257.0 Selected Balance Sheet Data Cash and cash equivalents Working capital Inventories at year-end Total assets Long-term debt, including current maturities Total stockholders' equity 312.5 1,277.3 1.158.5 4,006.4 792.0 2.018.6 $250.5 1,279.3 917.5 3,644.3 817.4 2,030.9 S 129.9 1,020.0 783.0 2,866.0 666.1 1,668 2 $ 593.2 1,127.8 536.7 2,092.4 281.5 1,350.3 Selected Cash Flow Data Net cash provided by operating activities $ 234.1 364.4 (S 14.5) $ 219.0 Under Armour's Revenues and Operating Income, by Product Category and Geographic Region, 2014-2017 EXHIBIT 3 A. Net revenues by product category (in millions of $ 2017 2016 2015 2014 Apparel Footweat Accessories Dollars Percent Dollars Percent Dollars Percent Dollars Percent $3,287 1 66.1% $3,229 1 66 9% $2,801.1 70.7% 853.5 80 2% 445.89 4066 43469 8.43.9 41 037.8 20.9 010720.9 677.7 17.1 127.2 12.0 Total net sales License revenues Connected fitness 47708 95.9% 4.6464 963% 3,825.7 96.6% $1,024.6 963% 116.6 2.3 89.2.8 99.8 80.4 84.2 53.4 $3,963 3 2.1 39.4 3.7 1.7 Total net revenues $4.9766 100 0% $4,825 3 100 0% 1000% $1,063 9 100 0% B. Net revenues by geographic region (in millions of $) 2017 2016 2015 2014 North America EMEA Asia-Pacific Latin America Connected fitness Total net revenues $3,802.4 470.0 433.6 181.3 $4,005.3 330.6 268.6 141.8 $3.455.8 203.1 44.9 106.2 $2,796.4 134.1 70.4 41.9 $4,976.6 $4,825.3 $3,963.3 $3,084.4 C. Operating income (loss) by geographic region (in millions of $) 2017 2016 $4084 11.4 68.3 2015 2014 372.3 s 20.2 1B.0 82.0 $461.0 North America EMEA Asia-Pacific Latin America Connected fitness 36.4 (30.6) (61.3 $408.5 21.9 (33 9) 553) S 27.8 (368 $417.5 13.1 $354.0 Total operating income EXHIBIT 2 Selected Financial Data for Under Armour, Inc., 2014-2017 (in millions) 2014 Selected Income Statement Data Net revenues Cost of goods sold 2017 2016 2015 4,976.6 2 737.8 2.238.7 2,086.8 24.0 27.8 $4,825.3 2584.7 2,240.6 1823.1 $3,963.3 2057 8 ,905.5 1,497.0 $3,084.4 Gross proft Selling. general and administrative expenses Restructuring and impairment charges 1.152 2 1512.2 1.158.3 408.5 (14.6) (72) 386.7 1313154.1 $ 232.6 417.5 (26.4) 28 388.3 354.0 (5.3) (6.4) 342.2 1342 $ 208.0 Income from operations Interest expense, net Other expense, net 34 (3.6) (10.3) Income (loss) before income taxes Provision for income taxes 38.0 Net income (loss) $ (48.3) $257.0 Selected Balance Sheet Data Cash and cash equivalents Working capital Inventories at year-end Total assets Long-term debt, including current maturities Total stockholders' equity 312.5 1,277.3 1.158.5 4,006.4 792.0 2.018.6 $250.5 1,279.3 917.5 3,644.3 817.4 2,030.9 S 129.9 1,020.0 783.0 2,866.0 666.1 1,668 2 $ 593.2 1,127.8 536.7 2,092.4 281.5 1,350.3 Selected Cash Flow Data Net cash provided by operating activities $ 234.1 364.4 (S 14.5) $ 219.0 Under Armour's Revenues and Operating Income, by Product Category and Geographic Region, 2014-2017 EXHIBIT 3 A. Net revenues by product category (in millions of $ 2017 2016 2015 2014 Apparel Footweat Accessories Dollars Percent Dollars Percent Dollars Percent Dollars Percent $3,287 1 66.1% $3,229 1 66 9% $2,801.1 70.7% 853.5 80 2% 445.89 4066 43469 8.43.9 41 037.8 20.9 010720.9 677.7 17.1 127.2 12.0 Total net sales License revenues Connected fitness 47708 95.9% 4.6464 963% 3,825.7 96.6% $1,024.6 963% 116.6 2.3 89.2.8 99.8 80.4 84.2 53.4 $3,963 3 2.1 39.4 3.7 1.7 Total net revenues $4.9766 100 0% $4,825 3 100 0% 1000% $1,063 9 100 0% B. Net revenues by geographic region (in millions of $) 2017 2016 2015 2014 North America EMEA Asia-Pacific Latin America Connected fitness Total net revenues $3,802.4 470.0 433.6 181.3 $4,005.3 330.6 268.6 141.8 $3.455.8 203.1 44.9 106.2 $2,796.4 134.1 70.4 41.9 $4,976.6 $4,825.3 $3,963.3 $3,084.4 C. Operating income (loss) by geographic region (in millions of $) 2017 2016 $4084 11.4 68.3 2015 2014 372.3 s 20.2 1B.0 82.0 $461.0 North America EMEA Asia-Pacific Latin America Connected fitness 36.4 (30.6) (61.3 $408.5 21.9 (33 9) 553) S 27.8 (368 $417.5 13.1 $354.0 Total operating income
Step by Step Solution
There are 3 Steps involved in it

Get step-by-step solutions from verified subject matter experts