

Question: What is the answer for question C The scatterplot shows the median starting salaries and the median mid-career salaries for graduates at a selection of

What is the answer for question C
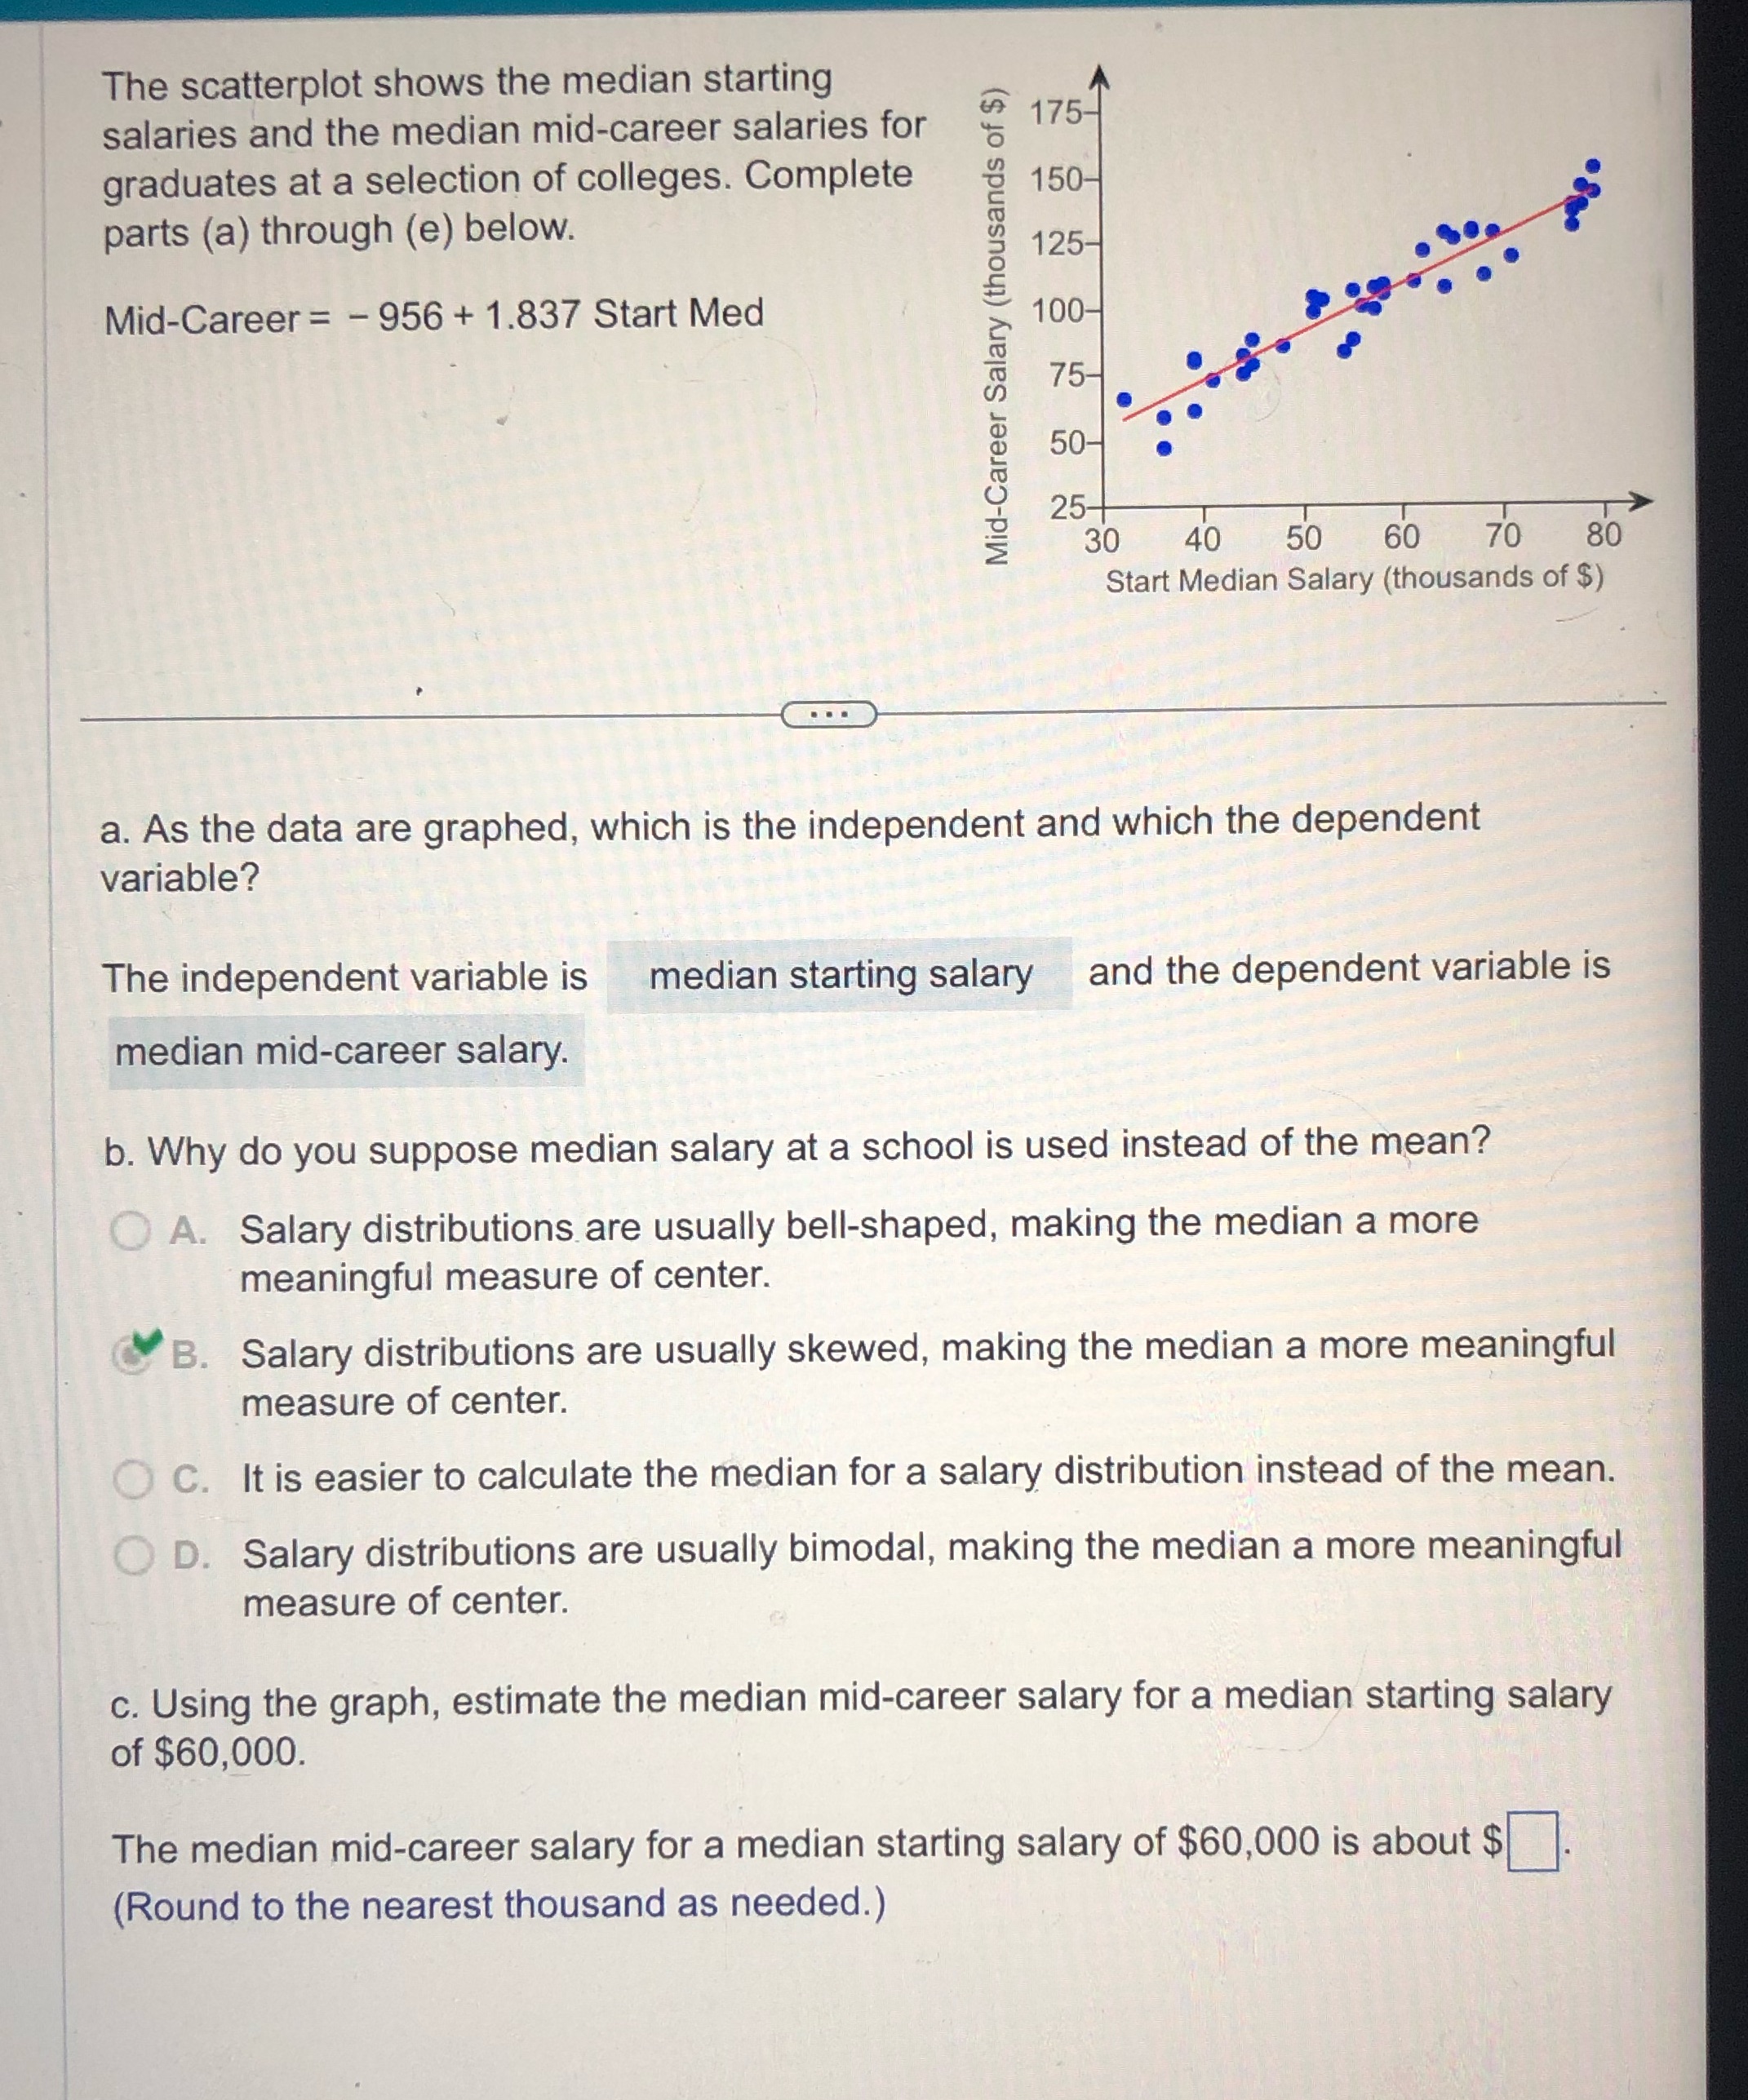
The scatterplot shows the median starting salaries and the median mid-career salaries for graduates at a selection of colleges. Complete parts (a) through (e) below. 175 150 125 ._x O C) Mid-Career = 956 + 1.837 Start Med NU'IN 01001 Mid-Career Salary (thousands of $) 30 4O 50 60 70 80 Start Median Salary (thousands of $) V E>--~ a. As the data are graphed, which is the independent and which the dependent variable? The independent variable is median starting salary and the dependent variable is median mid-career salary. b. Why do you suppose median salary at a school is used instead of the mean? Salary distributions are usually bellshaped, making the median a more meaningful measure of center. 9 Salary distributions are usually skewed, making the median a more meaningful measure of center. It is easier to calculate the median for a salary distribution instead of the mean. Salary distributions are usually bimodal, making the median a more meaningful measure of center. 0. Using the graph, estimate the median mid-career salary for a median starting salary of $60,000. The median mid-career salary for a median starting salary of $60,000 is about $D. (Round to the nearest thousand as needed.)
Step by Step Solution
There are 3 Steps involved in it

Get step-by-step solutions from verified subject matter experts