

Question: What's the answer for question D The scatterplot shows the median starting salaries and the median mid-career salaries for 12 175 graduates at a selection
What's the answer for question D
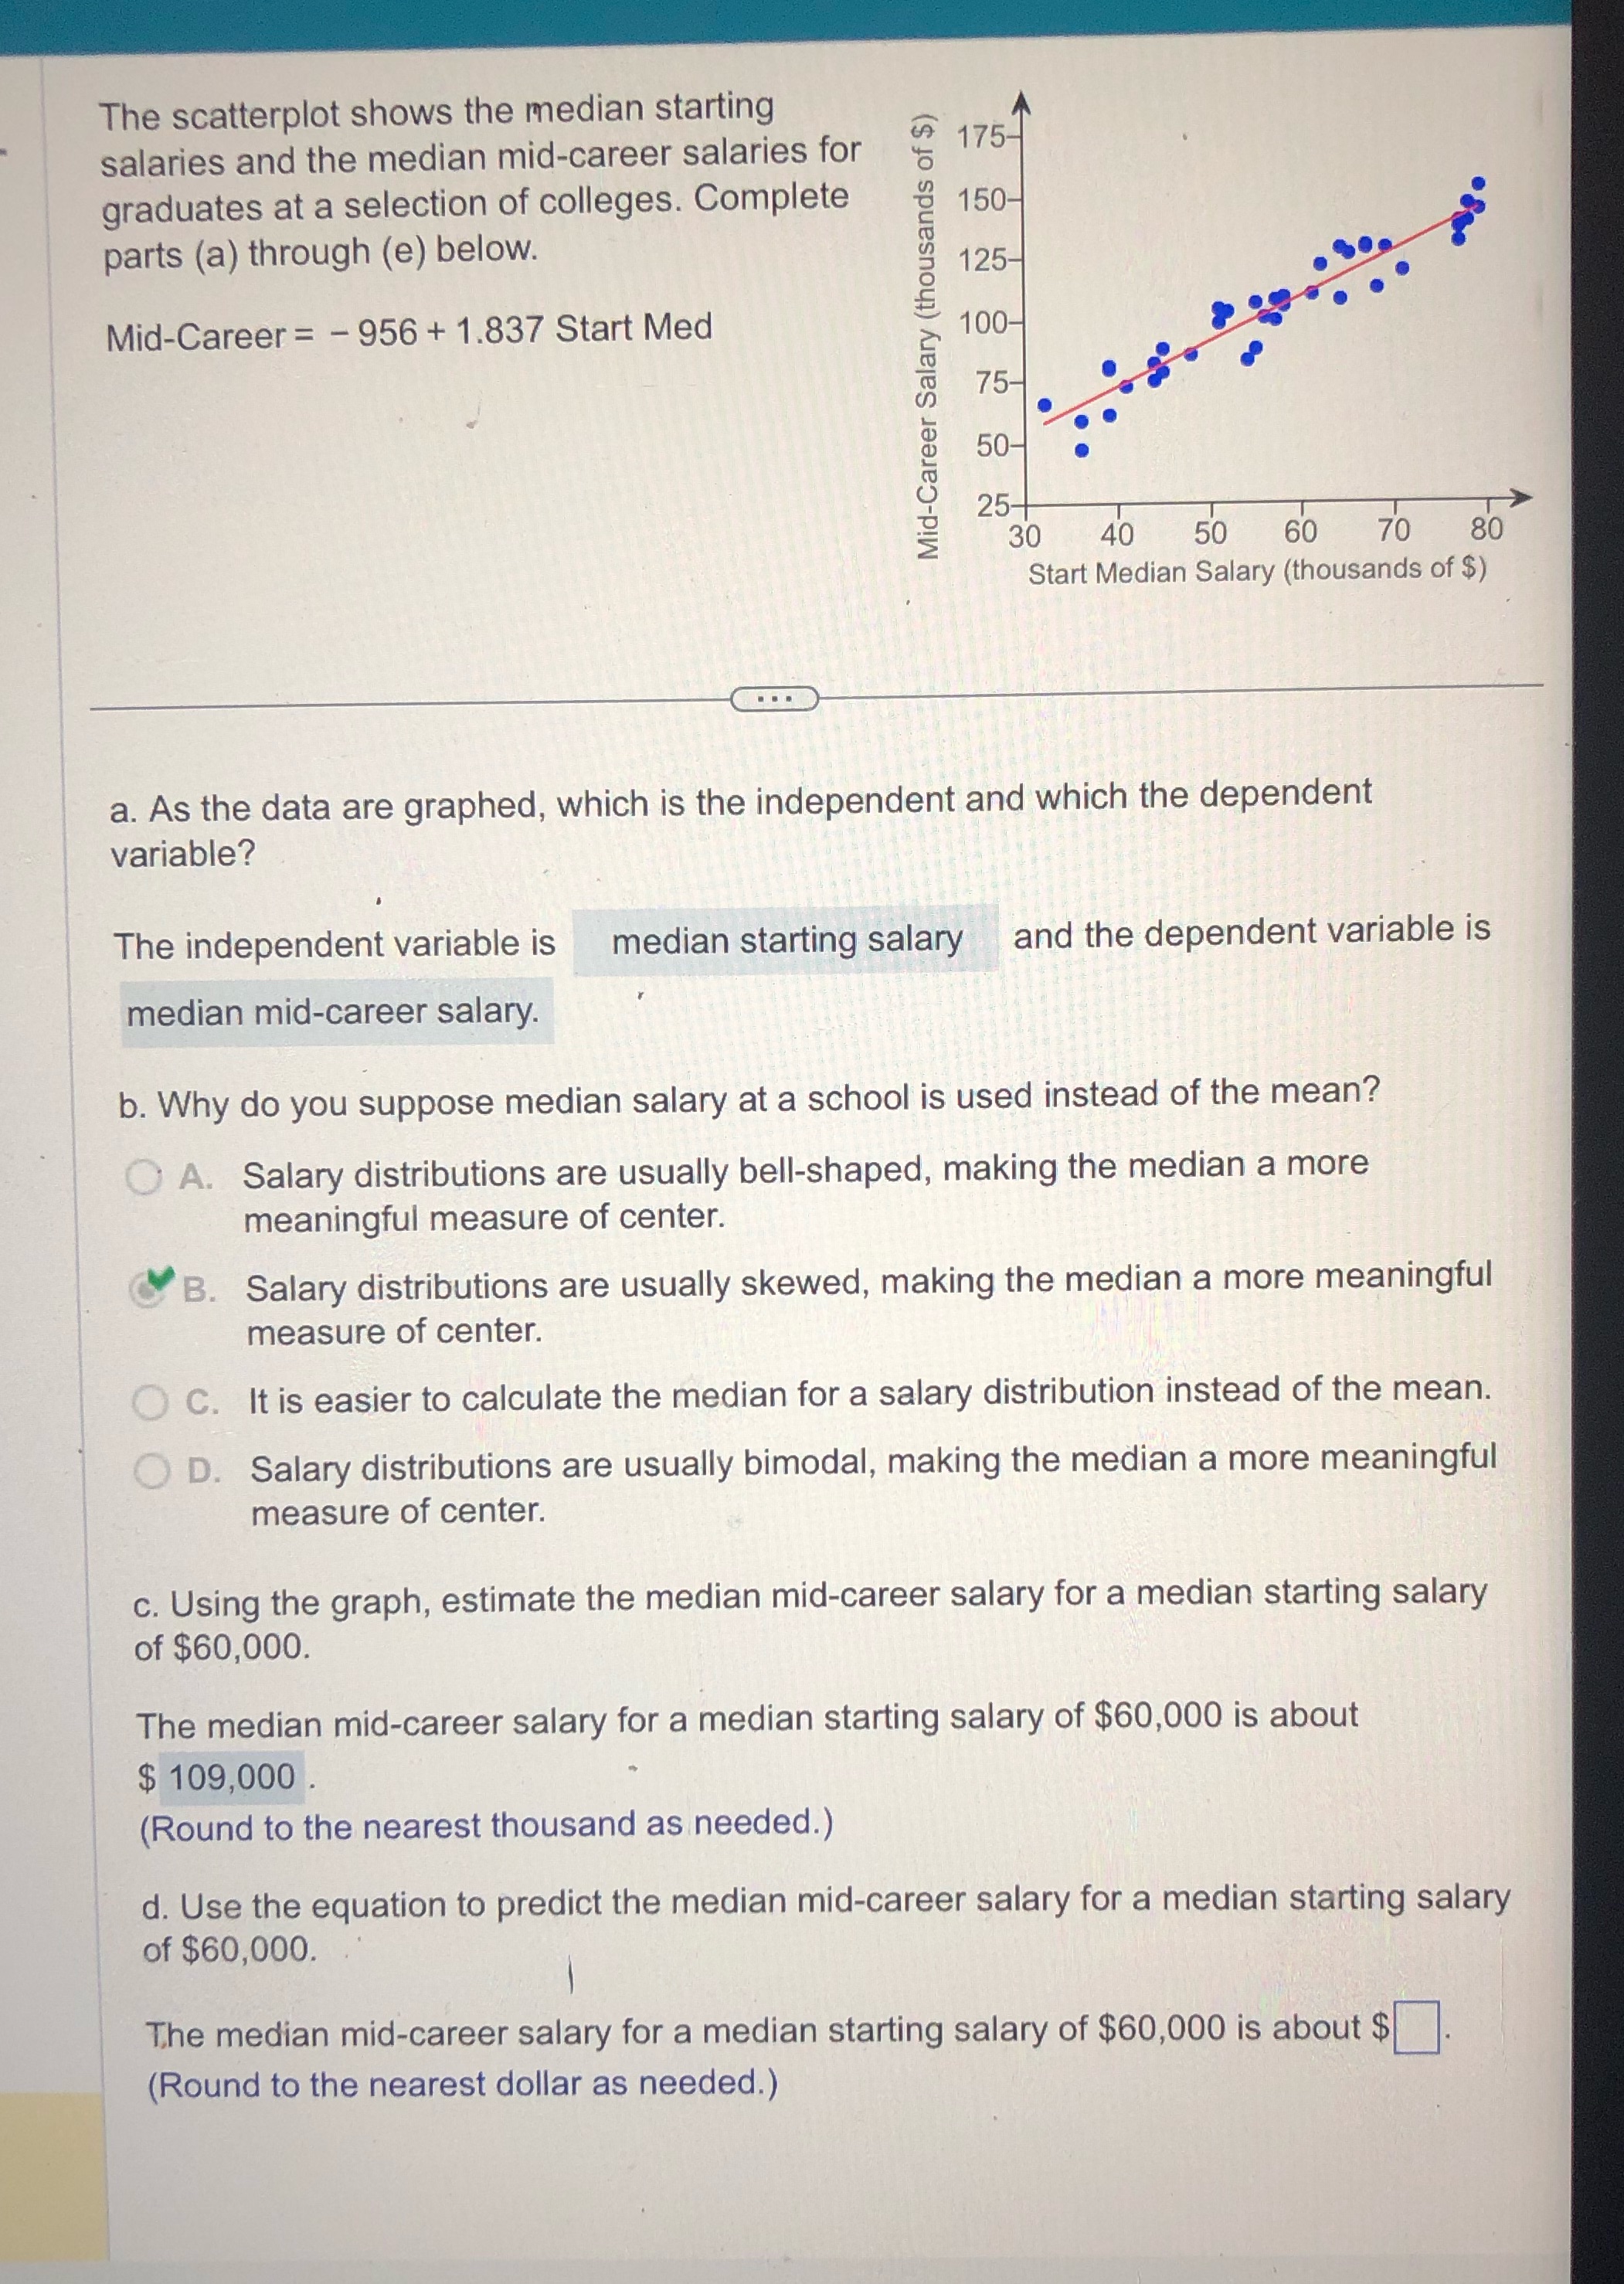
The scatterplot shows the median starting salaries and the median mid-career salaries for 12 175 graduates at a selection of colleges. Complete g 150 parts (a) through (e) below. g 125 J: ( _3. O O MidCareer = - 956 + 1.837 Start Med 01'] 001 25 30 40 50 60 70 80 Start Median Salary (thousands of $) Mid-Career Salary WM a. As the data are graphed, which is the independent and which the dependent variable? The independent variable is median starting salary and the dependent variable is median mid-career salary. b. Why do you suppose median salary at a school is used instead of the mean? Salary distributions are usually bell-shaped, making the median a more meaningful measure of center. V. Salary distributions are usually skewed, making the median a more meaningful measure of center. It is easier to calculate the median for a salary distribution instead of the mean. Salary distributions are usually bimodal, making the median a more meaningful measure of center. 0. Using the graph, estimate the median mid-career salary for a median starting salary of $60,000. The median mid-career salary for a median starting salary of $60,000 is about $ 109,000 . (Round to the nearest thousand as needed.) d. Use the equation to predict the median mid-career salary for a median starting salary of $60,000. ' The median mid-career salary for a median starting salary of $60,000 is about SD. (Round to the nearest dollar as needed.)
Step by Step Solution
There are 3 Steps involved in it

Get step-by-step solutions from verified subject matter experts