

Question: what is the answer to this ? The graph shows the demand for Headphones sold per month at small electronics store. The Price Elasticity of
what is the answer to this ?
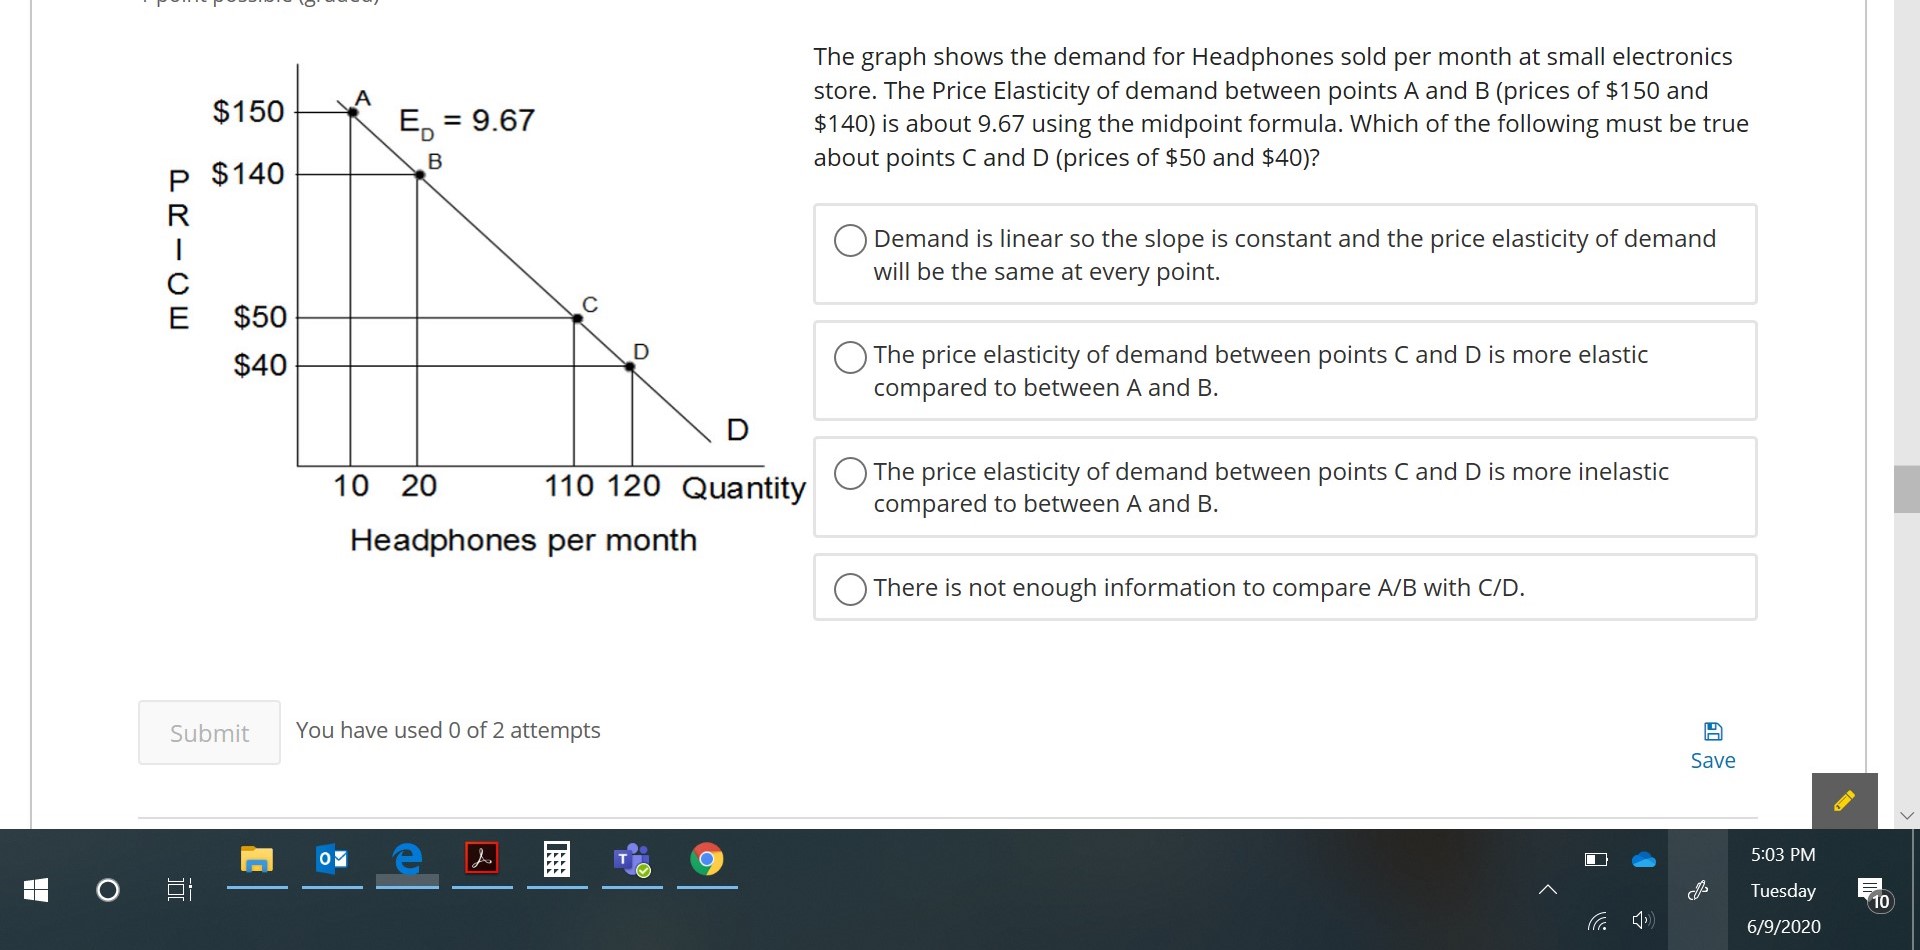
The graph shows the demand for Headphones sold per month at small electronics store. The Price Elasticity of demand between points A and B (prices of $150 and $150 $140) is about 9.67 using the midpoint formula. Which of the following must be true P $140 about points C and D (prices of $50 and $40)? R . . . . . . I 0 Demand Is linear so the slope Is constant and the price elastICIty of demand C will be the same at every point. E $50 $40 0 The price elasticity of demand between points C and D is more elastic compared to between A and B. . O The price elasticity of demand between points C and D is more inelastic 10 20 110 120 Qua ntlty compared to between A and B. Headphones per month OThere is not enough information to compare A/B with C/D. Submit You have used 0 of2 attempts Save 5:03 PM Tues d ay _ 020
Step by Step Solution
There are 3 Steps involved in it

Get step-by-step solutions from verified subject matter experts