

Question: What is the MAPE for the time span from day 5 to 10? Calculate the 3-day moving average to forecast the demand on day 11.
What is the MAPE for the time span from day 5 to 10? Calculate the 3-day moving average to forecast the demand on day 11. Calculate the 3-day weighted moving average to forecast the demand on day 11. Assign the weights 2, 2, and 1 to the last time period, the second most recent time period, and the third most recent time period, respectively.
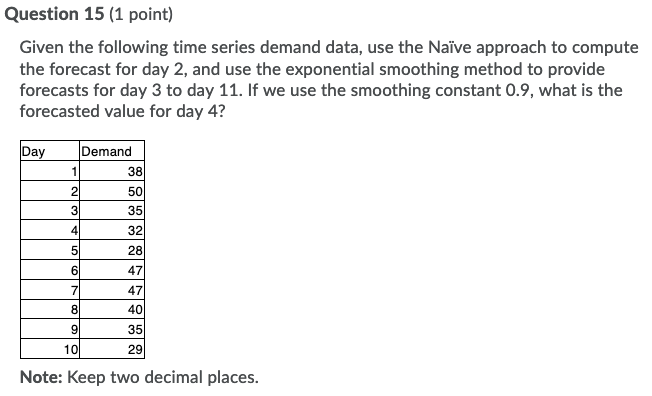
Question 15 (1 point) Given the following time series demand data, use the Nave approach to compute the forecast for day 2, and use the exponential smoothing method to provide forecasts for day 3 to day 11. If we use the smoothing constant 0.9, what is the forecasted value for day 4? Day Demand 1 38 21 50 3 35 4 32 5 6 7 28 47 47 40 35 8 9 10 29 Note: Keep two decimal placesStep by Step Solution
There are 3 Steps involved in it
1 Expert Approved Answer
Step: 1 Unlock

Question Has Been Solved by an Expert!
Get step-by-step solutions from verified subject matter experts
Step: 2 Unlock
Step: 3 Unlock