

Question: what is the steps for solution in Excel , Please I want the steps in detail and clear, I am a beginner in Excel and
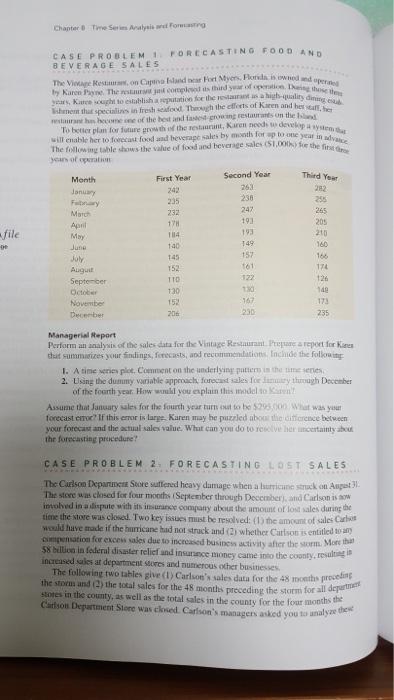
Chantier The Series Analysis we Forum will be her to forecast food and beverage byth for your Third You CASE PROBLEM 1 FORECASTING FOOD AND BEVERAGE SALES The Vin Roston Club For Myers Food pre by Karen Themes third when Kateht to establish a reputative for the restaurant and high-quality dining Ishment that specialises in frescafe Through the effects of Karen and here become of the best and progress on the The following table shows the value of food and beverage sale (51,00 fe the finales yen feperti Month First Year Second Year January 242 282 230 235 Fay 255 March 232 247 265 192 April 178 205 193 My 210 June 149 140 160 JON 157 166 August 752 161 174 September TTO 122 126 October 130 10 149 November 152 167 173 December 230 235 afile Managerial Report Perform an analysis of the sales data for the Vintage Restaurante a report for Kids that summarizes your findings, forecasts, and recommendations Inchide the following I. A time series plet. Comment on the underlying pattern in the time series 2. Using the dummy variable approach forecast sales lety through December of the fourth year. How will you explain this model tot Assume that January sales for the fourth year turn out to be $295.000 What was your forecast ertoe? If this error in large Karen may he pozried about the corence between your forecast and the actual sales value. What can you do to rolve her tainty the forecasting procedure? CASE PROBLEM 2. FORECASTING LOST SALES The Carlson Department Store suffered heavy damage when a suicine struck on August The store was closed for four months (September through December, and Carlson is imolved in a dispute with its insurance company about the amount or lost ales during the time the store was closed. Two key issues must be resolved: (1) the amount of sales Calvin would have made if the humicane had not struck and whether it so is entitled to pation for exces sales due to increased business activity after the storm. Meet that 58 billion in federal disaster relief and insurance money came into the county, resulting increased sales at department stores and numerous other businesses The following two tablesglve (1) Carlo's sales data for the 48 months preceding the stem and the total sales for the 48 months preceding the scem for all department stores in the county, as well as the total sales in the county for the four months the Cartoon Department Store was closed. Carlson's managers asked you to analyze tiek
Step by Step Solution
There are 3 Steps involved in it

Get step-by-step solutions from verified subject matter experts