

Question: What is the upper control limit? What is the center line ? What is the lower control limit ? A quality inspector took six samples,
What is the upper control limit?
What is the center line ?
What is the lower control limit ?
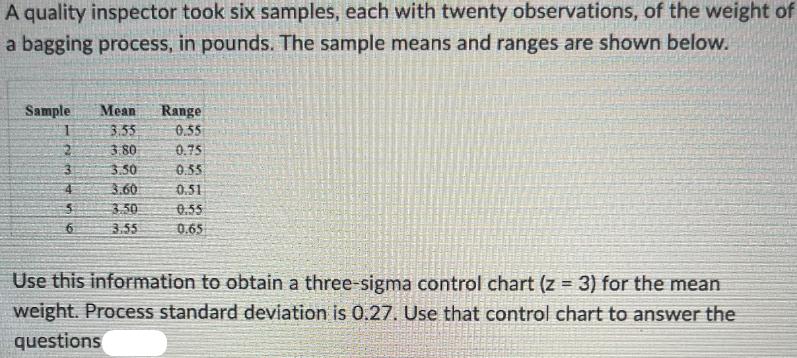
A quality inspector took six samples, each with twenty observations, of the weight of a bagging process, in pounds. The sample means and ranges are shown below. Sample 2 3 6 Mean 3.55 3.80 3.50 3.60 3.50 3.55 Range 0.55 0.75 0.55 0.51 0.55 0.65 Use this information to obtain a three-sigma control chart (z = 3) for the mean weight. Process standard deviation is 0.27. Use that control chart to answer the questions
Step by Step Solution
3.40 Rating (156 Votes )
There are 3 Steps involved in it
To create a threesigma control chart for the mean weight youll need to calculate the upper control l... View full answer

Get step-by-step solutions from verified subject matter experts