

Question: What lessons can be learned based on these performance highlights? 4/28/24, 10:12 PM BSG Decisions & Reports Year 18 INewerBalance PERFORMANCE HIGHLIGHTS (Industry 75) Year
What lessons can be learned based on these performance highlights?
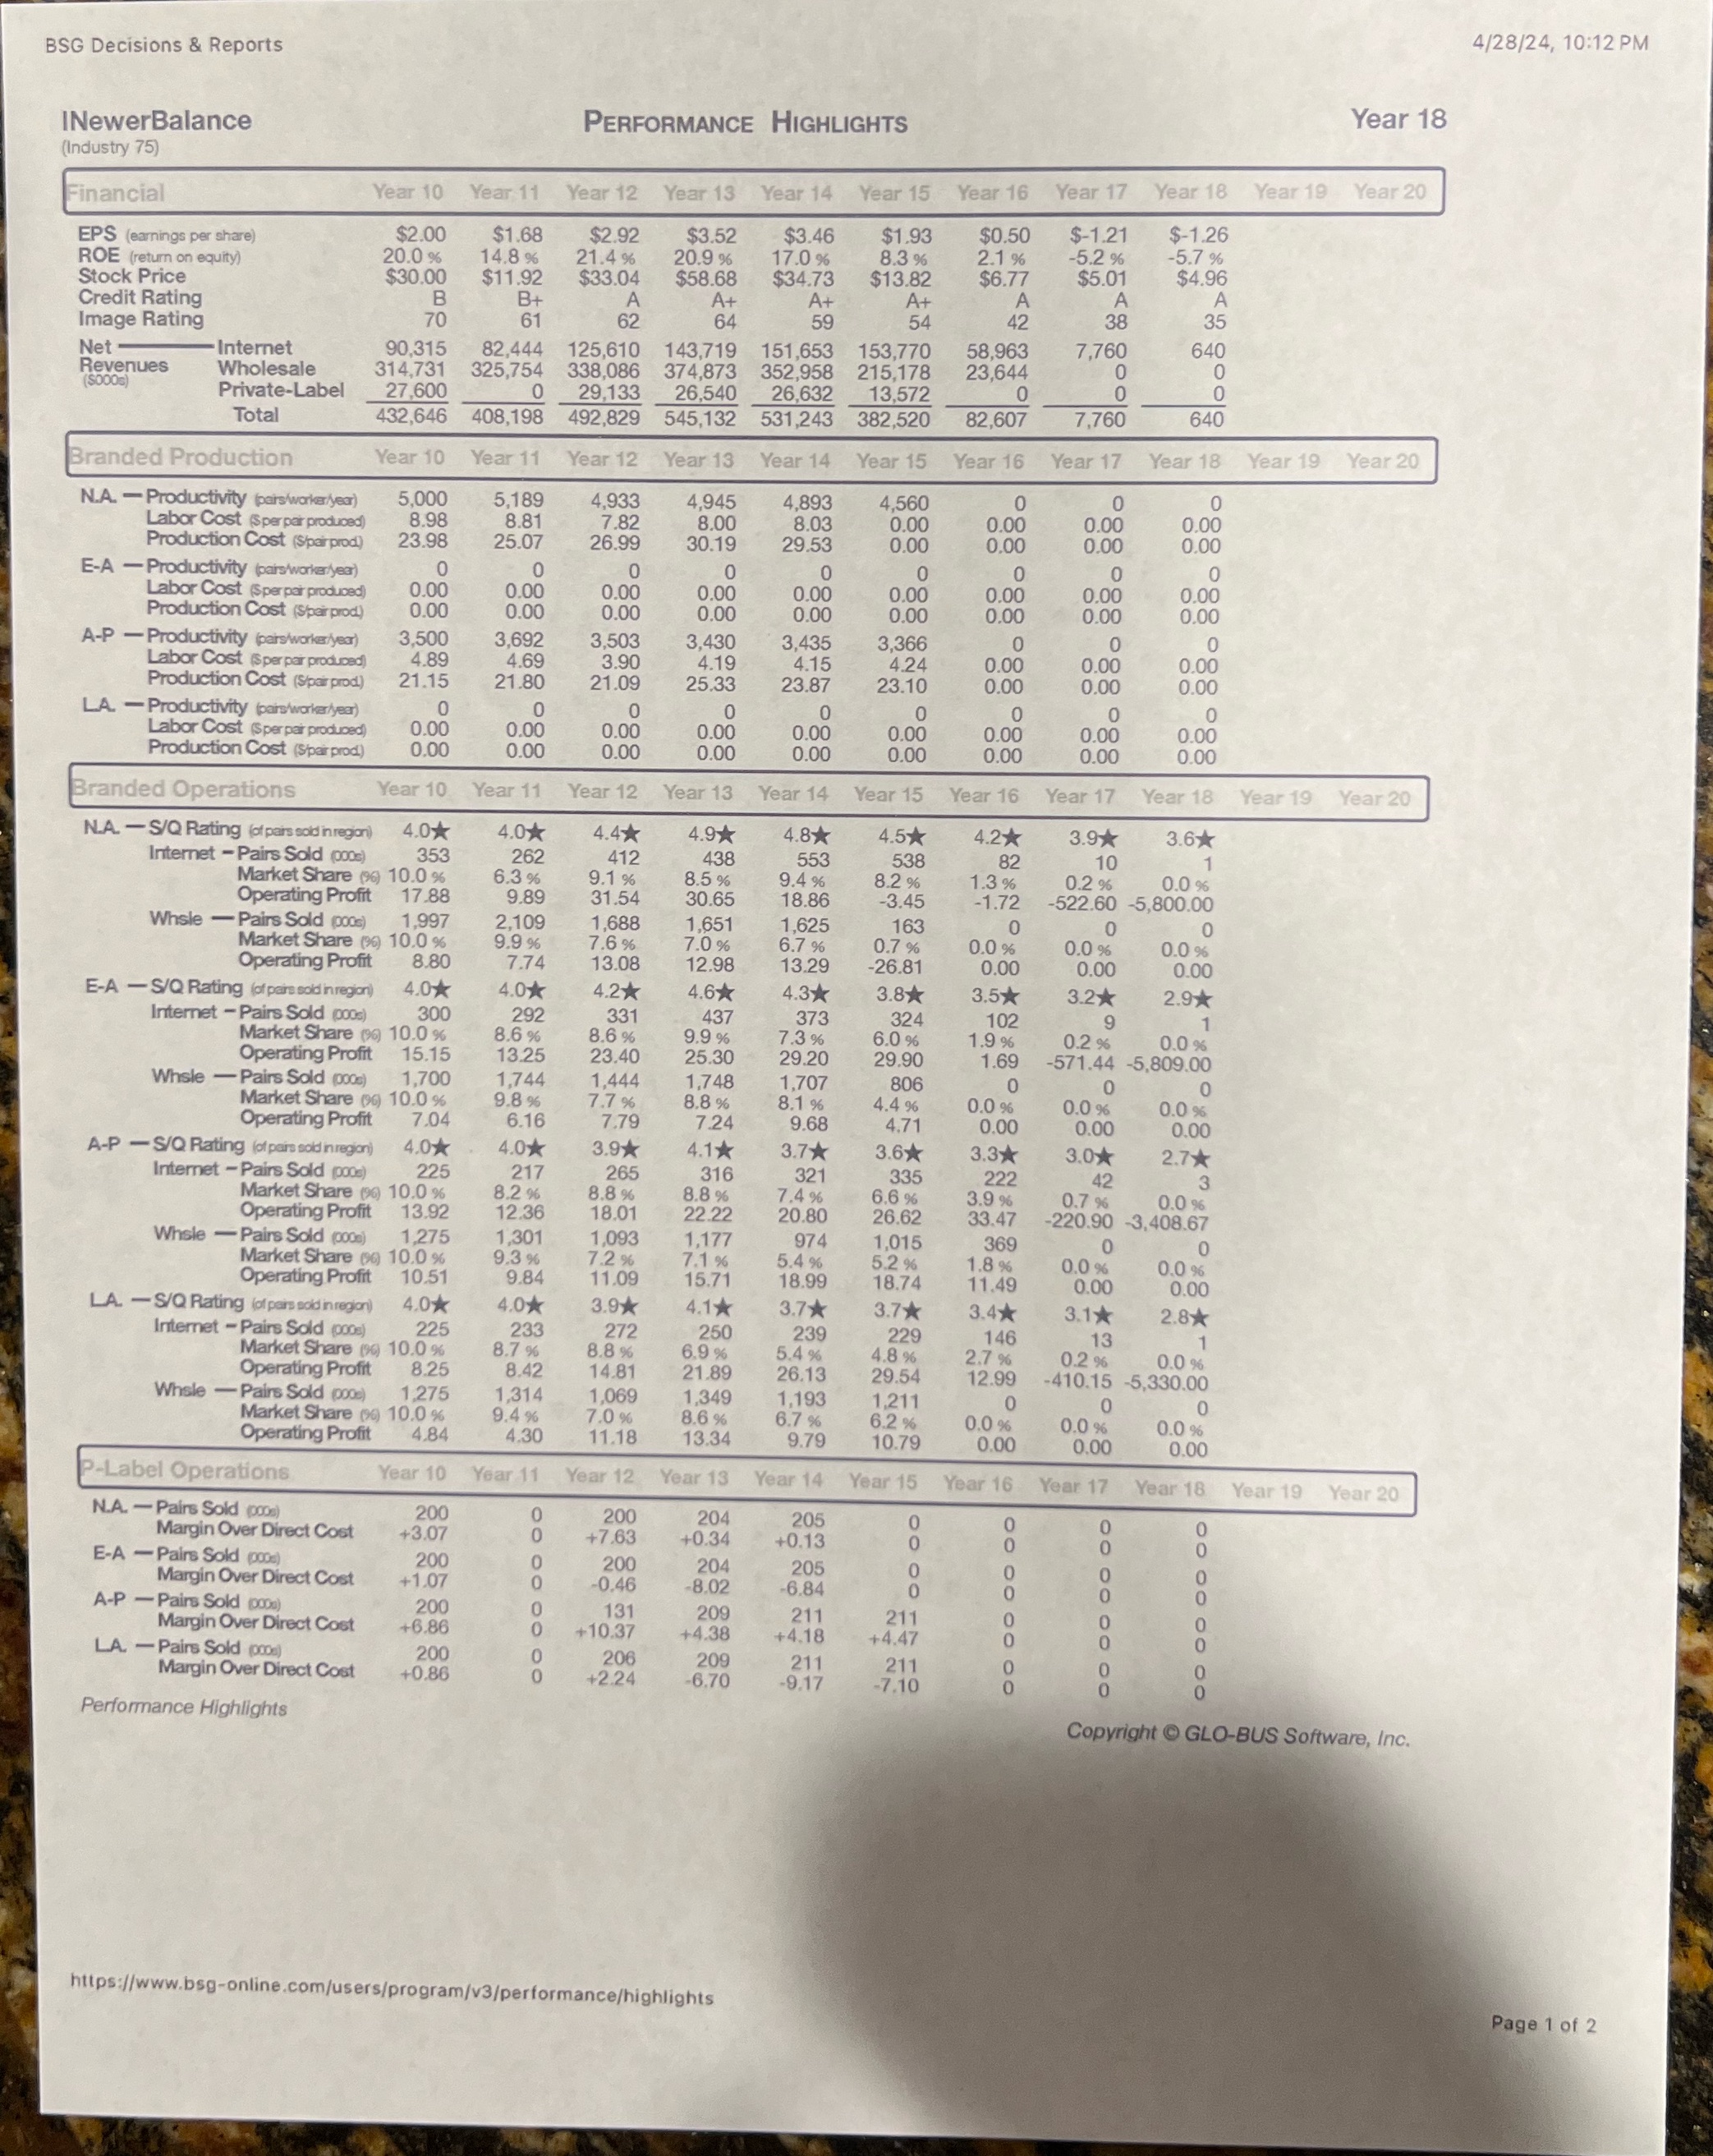
4/28/24, 10:12 PM BSG Decisions & Reports Year 18 INewerBalance PERFORMANCE HIGHLIGHTS (Industry 75) Year 10 Year 11 Year 12 Year 13 Year 14 Year 15 Year 16 Year 17 Year 18 Year 19 Year 20 inancial $3.52 $3.46 $1.93 $0.50 $-1.21 $-1.26 EPS (earnings per share) $2.00 $1.68 $2.92 ROE (return on equity) 20.0% 14.8 9 21.4 % 20.9% 17.0% 8.3% 2.1% -5.2% -5.7% $5.01 $4 96 $30.00 $11.92 $33 04 $58.68 $34.73 $13.82 $6 77 Stock Price At At A A Credit Rating B B+ At 59 54 38 35 62 64 42 61 Image Rating 70 90.315 82,444 125,610 143,719 151,653 153,770 58,963 7.760 640 Net Internet 352,958 215,178 23,644 0 0 Revenues Wholesale 314,731 325.754 338,086 374,873 0 0 SOOOs) Private-Label 27,600 29,133 26,540 26,632 13,572 7,760 640 Total 432,646 408,198 492,829 545,132 531,243 382,520 82,607 Year Year 15 Year 16 Year 17 Year 18 Year 19 Year 20 Branded Production Year 11 Year 12 Year 14 N.A. - Productivity (pairs/worker/year) 1000 5,189 1,933 4,945 4,893 4,560 0 0 8.03 0.00 0.00 0.00 0.00 Labor Cost (Sper pair produced) 8.98 8.81 7.82 8.00 26.99 30.19 29.53 0 00 0.00 0.00 0 00 Production Cost (Spair p 23.98 25.07 0 0 0 0 E-A -Productivity (pairs/worker/year) 0.00 Labor Cost (Sperpair produced) 0.00 0.00 0.00 0.00 0.00 0.00 0.00 0.00 Production Cost (Spar prod) 0.00 0.00 0.00 0.00 0.00 0.00 0.00 0 00 0.00 A-P - Productivity (pars/worker/year) 3.500 3.692 3.503 3.430 3.435 3.366 0 0.00 Labor Cost (Sper pair produced) 4.89 4.69 3.90 4.19 4.15 4.24 0.00 0.00 21.80 21.09 25.33 23.87 23.10 0 00 0.00 0.00 Production Cost (S/pair prod) 21 15 0 0 0 0 C 0 LA - Productivity pan 0 0 Labor Cost (Sper pair produced) 0.00 0.00 0.00 0.00 0.00 0.00 0.00 0.00 0.00 Production Cost (S'par prod) 0.00 0.00 0.00 0.00 0 00 0 00 0.00 0.00 0.00 Year 10 Year 12 Year 13 Year 14 Year 15 Year 16 Year 17 Year 18 Year 19 Year 20 Operations 3.6 N.A. - S/Q Rating (of pars sold inregion) 4.0* 4.0% 1.4X
Step by Step Solution
There are 3 Steps involved in it

Get step-by-step solutions from verified subject matter experts