

Question: What type of study is used in the article (quantitative or qualitative)? Explain how you came to that conclusion. What type of graph or table

- Whattypeof study is used in the article (quantitative or qualitative)?
- Explainhow you came to that conclusion.
- Whattypeof graph or table did you choose for your lab (bar graph, histogram, stem & leaf plot, etc.)?
- What characteristics make it this type (you should bring in material that you learned in the course)?
- Describethe data displayed in your frequency distribution or graph (consider class size, class width, total frequency, list of frequencies, class consistency, explanatory variables, response variables, shapes of distributions, etc.)
- Draw a conclusionabout the data from the graph or frequency distribution in the context of the article.
- Howelse might this data have been displayed?
- Discuss the pros and cons of2 other presentation options, such as tables or different graphical displays.
- Whydo you think those two other presentation options (i.e., tables or different graphs) werenotused in this article?
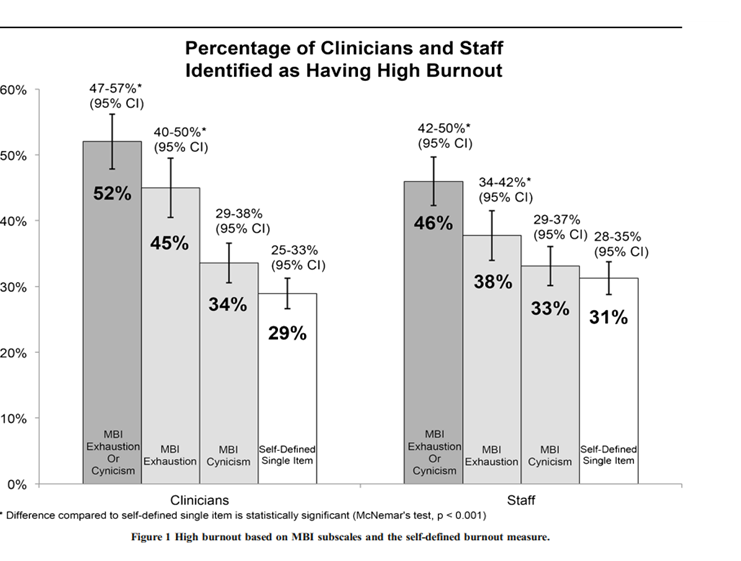
Percentage of Clinicians and Staff Identified as Having High Burnout 60% 47-57%* (95% CI) 40-50% 42-50% (95% CI) (95% CI) 50% 34-42%* 52% (95% CI) 29-38% 40% 29-37% (95% CI) 46% 45% (95% CI) 28-35% 25-33% (95% CI) (95% CI) 30% 38% 34% 33% 31% 29% 20% 10% MBI MBI Exhaustion MBI MBI Self-Defined Exhaustion MBI MBI Self-Defined Or Exhaustion Cynicism Single Item Or Exhaustion Cynicism Single Item Cynicism Cynicism 0% Clinicians Staff Difference compared to self-defined single item is statistically significant (McNemar's test, p
Step by Step Solution
There are 3 Steps involved in it
1 Expert Approved Answer
Step: 1 Unlock

Question Has Been Solved by an Expert!
Get step-by-step solutions from verified subject matter experts
Step: 2 Unlock
Step: 3 Unlock