

Question: What type of study is used in the article (quantitative or qualitative)? Explain how you came to that conclusion. What type of graph or table
- What type of study is used in the article (quantitative or qualitative)? Explain how you came to that conclusion.
- What type of graph or table did you choose for your lab (bar graph, histogram, stem & leaf plot, etc.)? What characteristics make it this type (you should bring in material that you learned in the course)?
- Describe the data displayed in your frequency distribution or graph (consider class size, class width, total frequency, list of frequencies, class consistency, explanatory variables, response variables, shapes of distributions, etc.)
- Draw a conclusion about the data from the graph or frequency distribution in context of the article.
- How else might this data have been displayed? Discuss pros and cons of 2 other presentation options, such as tables or different graphical displays. Why don't you think those two graphs were not used in this article?
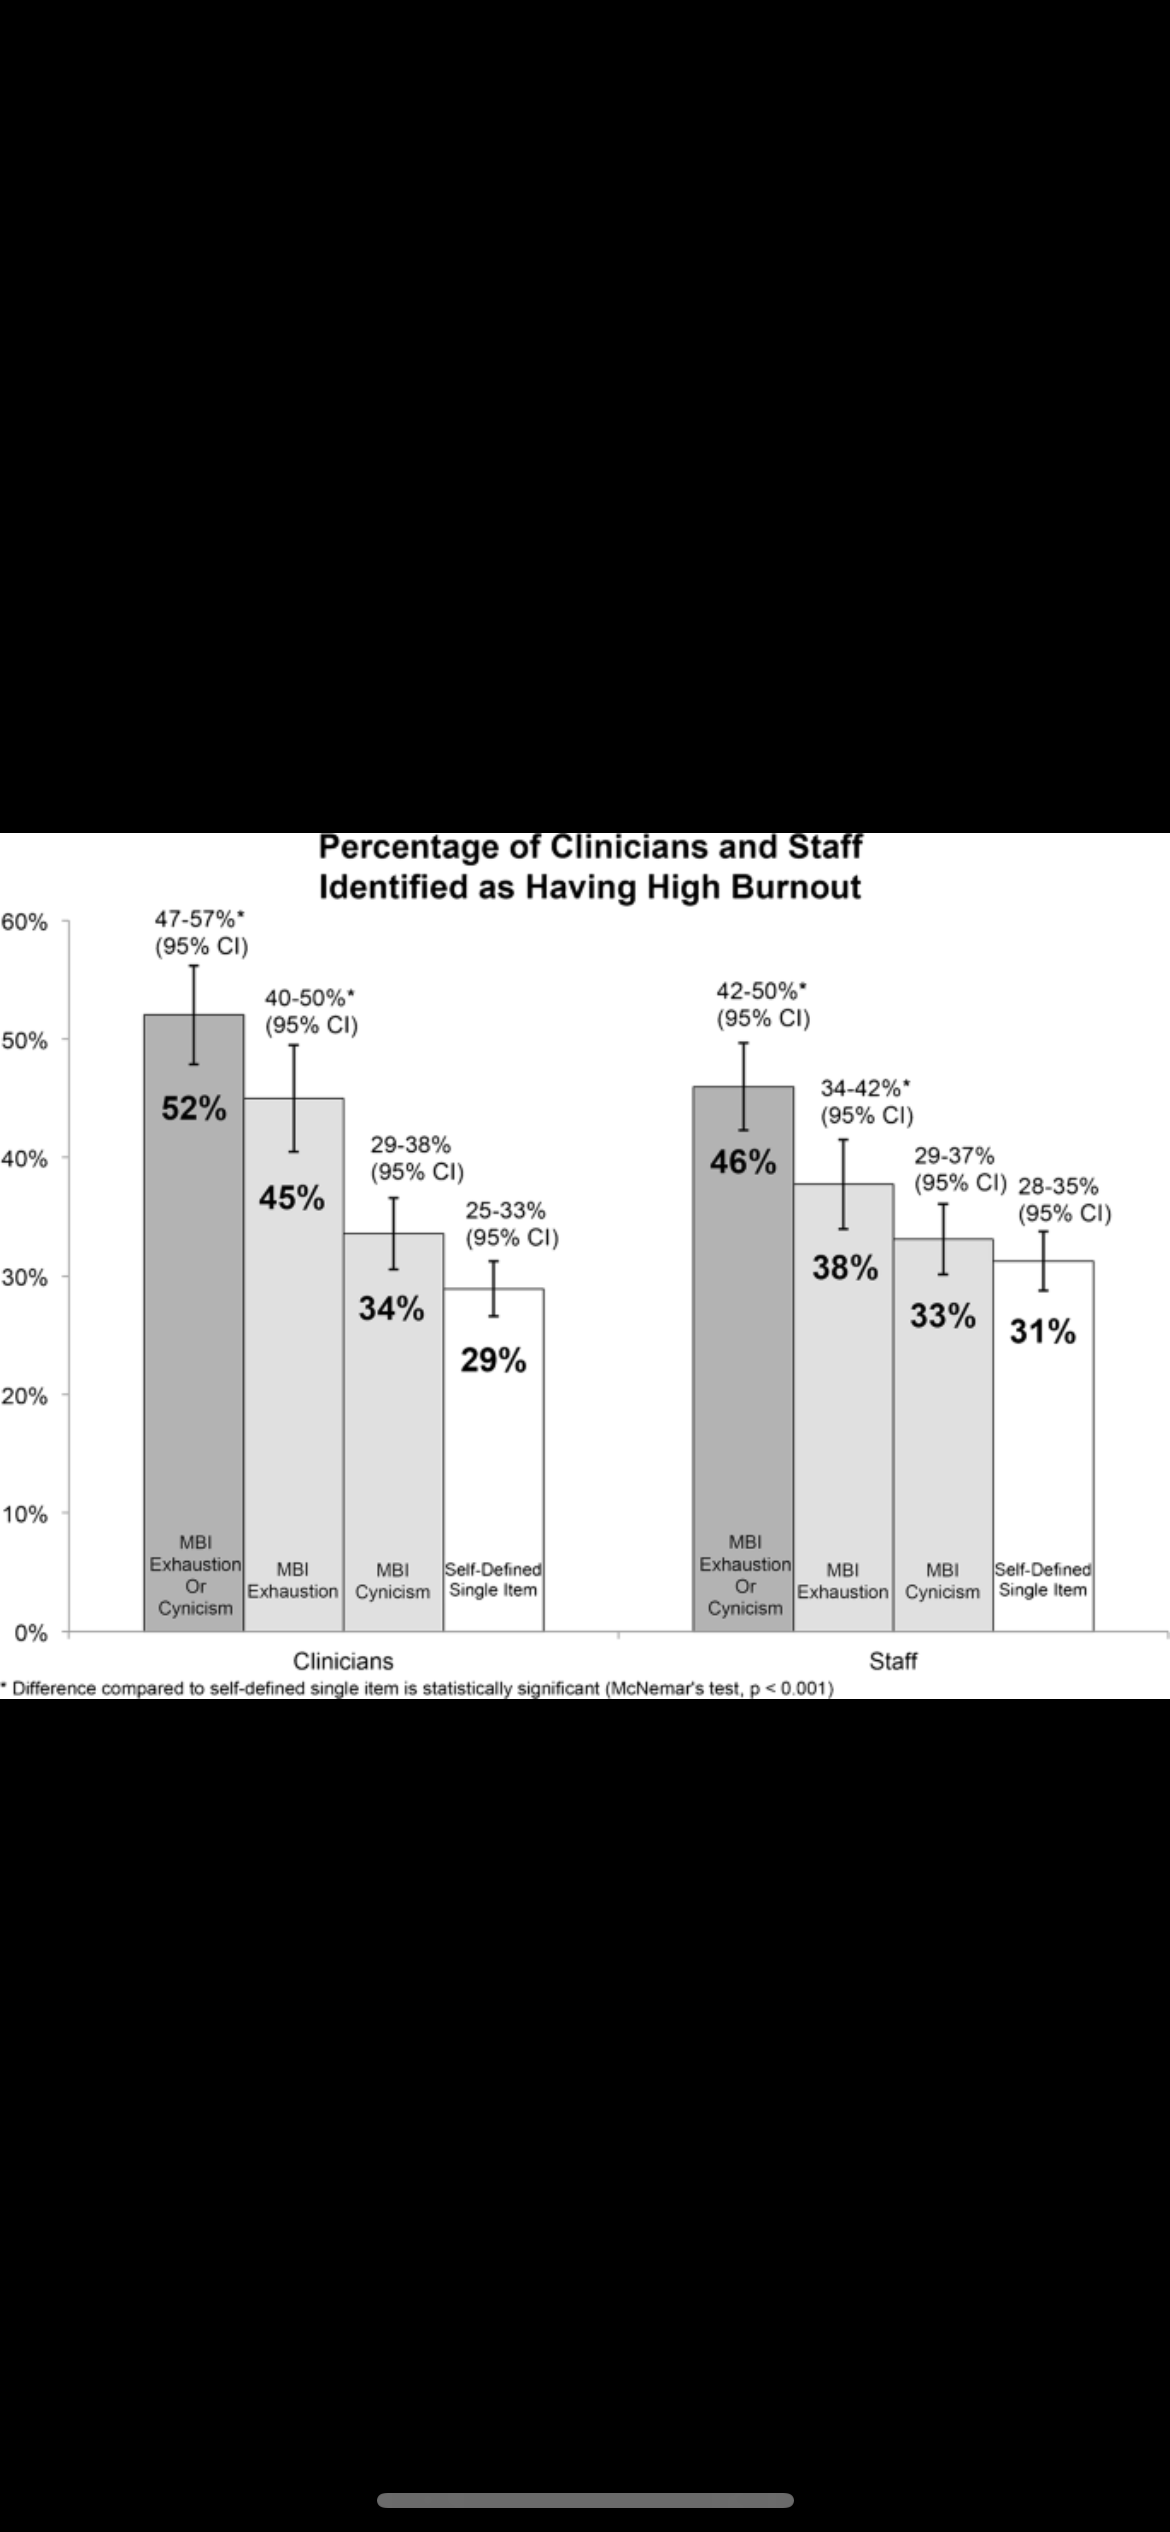
Percentage of Clinicians and Staff Identified as Having High Burnout 60% 47-57%* (95% CI) 40-50%" 42-50%* (95% CI) (95% CI) 50% 34-42%* 52% (95% CI) 29-38% 40% 46% 29-37% (95% CI) (95% CI) 28-35% 45% 25-33% (95% CI) (95% CI) 30% 38% 34% 33% 31% 29% 20% 10% MBI MBI Exhaustion MBI MBI Self-Defined Exhaustion MB MBI Self-Defined Or Exhaustion Cynicism Single Item Or Exhaustion Cynicism Single Item Cynicism Cynicism 0% Clinicians Staff Difference compared to self-defined single item is statistically significant (McNemar's test, p
Step by Step Solution
There are 3 Steps involved in it
1 Expert Approved Answer
Step: 1 Unlock

Question Has Been Solved by an Expert!
Get step-by-step solutions from verified subject matter experts
Step: 2 Unlock
Step: 3 Unlock