

Question: What variables can I compare between them to explain the financial development of China. In order to make 3 graphs with scatter plots. The picture
What variables can I compare between them to explain the financial development of China.
In order to make 3 graphs with scatter plots.
The picture is an example of what I would like to do.
use World bank datasets:
- World Development indicators
-Worldwide governance indicators
- Global Financial inclusion (Global Findex) Database
-Global financial development database
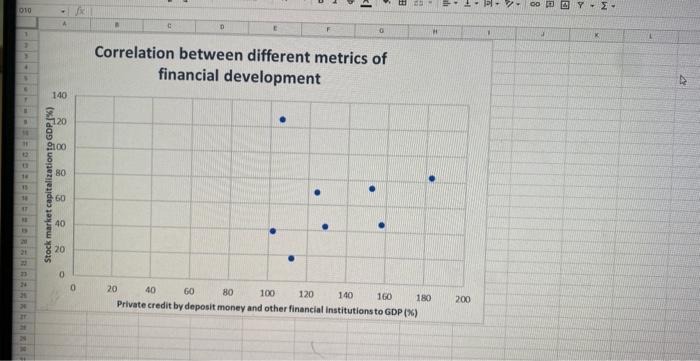
Correlation between different metrics of financial development
Step by Step Solution
There are 3 Steps involved in it
1 Expert Approved Answer
Step: 1 Unlock

Question Has Been Solved by an Expert!
Get step-by-step solutions from verified subject matter experts
Step: 2 Unlock
Step: 3 Unlock