Question: What was team PP's capacity utilization in Quarter 1 ONLY? 100.00% 50.33% 66.94% 61.08% 92.16% 2 3 4 5 6 7 8 9 0 1
What was team PP's capacity utilization in Quarter 1 ONLY?
| | | 100.00% |
| | | 50.33% |
| | | 66.94% |
| | | 61.08% |
| | | 92.16%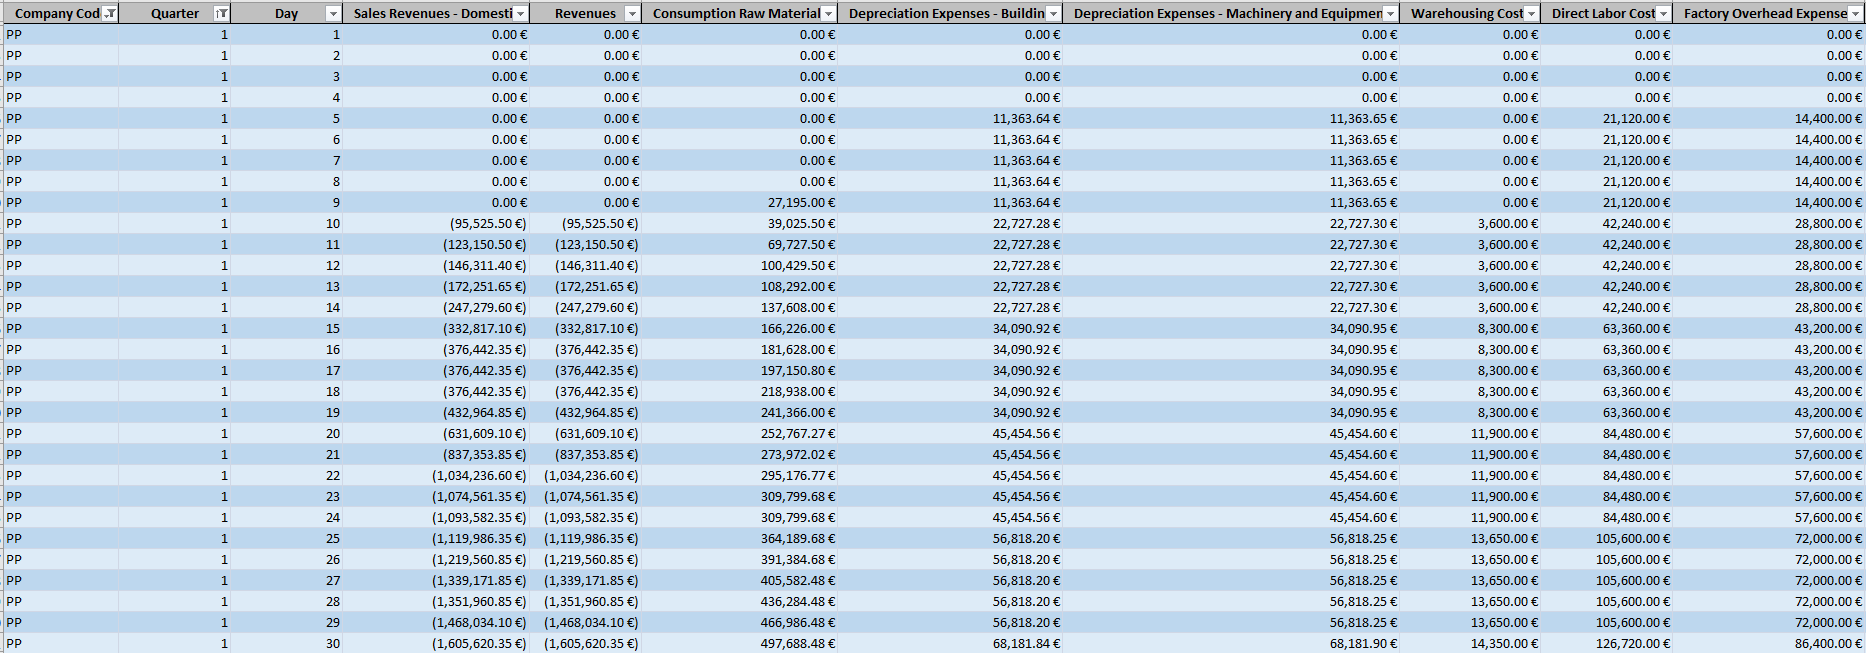 |
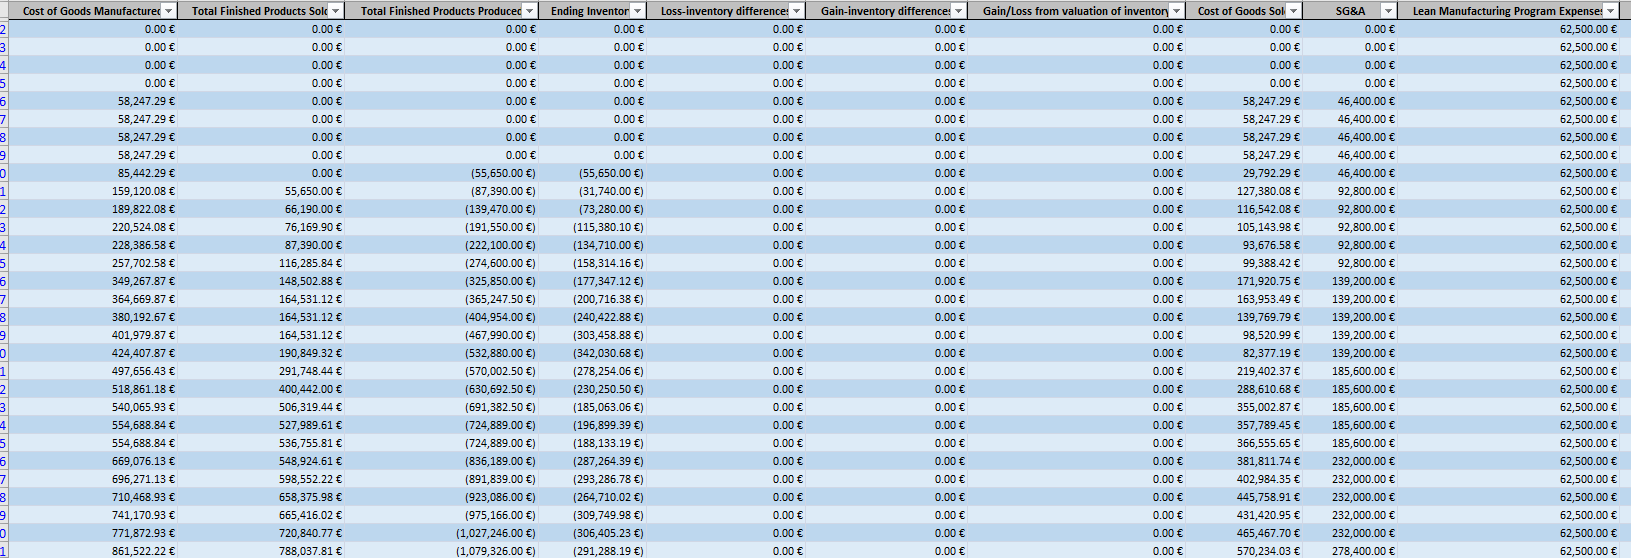
2 3 4 5 6 7 8 9 0 1 2 3 4 5 6 7 7 8 Cost of Goods Manufacturer 0.00 0.00 0.00 0.00 58,247.29 58,247.29 58,247.29 58,247.29 85,442.29 159,120.08 189,822.08 220,524.08 228,386.58 257,702.58 349,267.87 364,669.87 380,192.67 401,979.87 424,407.87 497,656.43 518,861.18 540,065.93 554,688.84 554,688.84 669,076.13 696,271.13 710,468,93 741,170.93 771,872.93 861,522.22 Total Finished Products Sol 0.00 0.00 0.00 0.00 0.00 0.00 0.00 0.00 0.00 55,650.00 66,190.00 76,169.90 87,390.00 116,285.84 148,502.88 164,531.12 164,531.12 164,531.12 190,849.32 291,748.44 400.442.00 506,319.44 527,989.61 536,755.81 548,924.61 598,552.22 658,375.98 665,416.02 720,840.77 788,037.81 Total Finished Products Producer Ending Inventor 0.00 0.00 0.00 0.00 0.00 0.00 0.00 0.00 0.00 0.00 0.00 0.00 0.00 0.00 0.00 0.00 (55,650.00 ) (55,650.00 ) (87,390.00 ) (31,740.00 ) (139,470.00 ) (73,280.00 ) (191,550.00 ) (115,380.10 ) (222,100.00 ) (134,710.00 ) (274,600.00 ) (158,314.16 ) (325,850.00 ) (177,347.12 ) (365,247.50 ) (200,716.38 ) (404,954.00 ) (240,422.88 ) (467,990.00 ) (303,458.88 ) (532,880.00 ) (342,030.68 ) (570,002.50 ) (278,254.06 ) (630,692.50 ) ( (230,250.50 ) (691,382.50 ) (185,063.06 ) (724,889.00 ) (196,899.39 ) (724,889.00 ) (188,133.19 ) (836,189.00 ) (287,264.39 ) (891,839.00 ) (293,286.78 ) (923,086.00 ) (264,710.02 ) (975,166.00 ) (309,749.98 ) (1,027,246.00 ) (306,405.23 ) (1,079,326.00 ) (291,288.19 ) Loss-inventory difference: 0.00 0.00 0.00 0.00 0.00 0.00 0.00 0.00 0.00 0.00 0.00 0.00 0.00 0.00 0.00 0.00 0.00 0.00 0.00 0.00 0.00 0.00 0.00 0.00 0.00 0.00 0.00 0.00 0.00 0.00 Gain-inventory difference: 0.00 0.00 0.00 0.00 0.00 0.00 0.00 0.00 0.00 0.00 0.00 0.00 0.00 0.00 0.00 0.00 0.00 0.00 0.00 0.00 0.00 0.00 0.00 0.00 0.00 0.00 0.00 0.00 0.00 Gain/Loss from valuation of inventory 0.00 0.00 0.00 0.00 0.00 0.00 0.00 0.00 0.00 0.00 0.00 0.00 0.00 0.00 0.00 0.00 0.00 0.00 0.00 0.00 0.00 0.00 0.00 0.00 0.00 0.00 0.00 0.00 0.00 0.00 Cost of Goods Sol 0.00 0.00 0.00 0.00 58,247.29 58,247.29 58,247.29 58,247.29 29,792.29 127,380.08 116,542.08 105,143.98 93,676.58 99,388.42 171,920.75 163,953.49 139,769.79 98,520.99 82,377.19 219,402.37 288,610.68 355,002.87 357,789.45 366,555.65 381,811.74 402,984.35 445,758.91 431,420.95 465,467.70 570,234.03 SG&A 0.00 0.00 0.00 0.00 46,400.00 46,400.00 46,400.00 46,400.00 46,400.00 92,800.00 92,800.00 92,800.00 92,800.00 92,800.00 139,200.00 139,200.00 139,200.00 139,200.00 139,200.00 185,600.00 185,600.00 185,600.00 185,600.00 185,600.00 232,000.00 232,000.00 232,000.00 232,000.00 232,000.00 278,400.00 Lean Manufacturing Program Expense: 62,500.00 62,500.00 62,500.00 62,500.00 62,500.00 62,500.00 62,500.00 62,500.00 62,500.00 62,500.00 62,500.00 62,500.00 62,500.00 62,500.00 62,500.00 62,500.00 62,500.00 62,500.00 62,500.00 62,500.00 62,500.00 62,500.00 62,500.00 62,500.00 62,500.00 62,500.00 62,500.00 62,500.00 62,500.00 62,500.00 9 0 1 2 3 4 5 6 7 8 9 0 1 0.00 Quarter TT Day Company Cody PP 1 1 PP 1 2 PP 1 3 PP 1 4 PP 1 5 PP 1 6 1 PP PP 7 8 1 PP 1 9 PP 1 10 PP 1 11 PP 12 1 1 PP 13 PP 1 14 PP 1 15 Sales Revenues - Domesti Revenues - 0.00 0.00 0.00 0.00 0.00 0.00 0.00 0.00 0.00 0.00 0.00 0.00 0.00 0.00 0.00 0.00 0.00 0.00 (95,525.50 ) (95,525.50 ) (123,150.50 ) (123,150.50 ) (146,311.40 ) (146,311.40 ) (172,251.65 ) (172,251.65 ) (247,279.60 ) (247,279.60 ) (332,817.10 ) (332,817.10 ) (376,442.35 ) (376,442.35 ) (376,442.35 ) (376,442.35 ) (376,442.35 ) (376,442.35 ) (432,964.85 ) (432,964.85 ) (631,609.10 ) (631,609.10 ) (837,353.85 ) (837,353.85 ) (1,034,236.60 ) (1,034,236.60 ) (1,074,561.35 ) (1,074,561.35 ) (1,093,582.35 ) (1,093,582.35 ) (1,119,986.35 ) (1,119,986.35 ) (1,219,560.85 ) (1,219,560.85 ) (1,339,171.85 ) (1,339,171.85 ) (1,351,960.85 ) (1,351,960.85 ) (1,468,034.10 ) (1,468,034.10 ) (1,605,620.35 ) (1,605,620.35 ) Consumption Raw Material Depreciation Expenses - Buildin 0.00 0.00 0.00 0.00 0.00 0.00 0.00 0.00 0.00 11,363.64 0.00 11,363.64 0.00 11,363.64 0.00 11,363.64 27,195.00 11,363.64 39,025.50 22,727.28 69,727.50 22,727.28 100,429.50 22,727.28 108,292.00 22,727.28 137,608.00 22,727.28 166,226.00 34,090.92 181,628.00 34,090.92 197,150.80 34,090.92 218,938.00 34,090.92 241,366.00 34,090.92 252,767.27 45,454.56 273,972.02 45,454.56 295,176.77 45,454.56 309,799.68 45,454.56 309,799.68 45,454.56 364,189.68 56,818.20 391,384.68 56,818.20 405,582.48 56,818.20 436,284.48 56,818.20 466,986.48 56,818.20 497,688.48 68,181.84 Depreciation Expenses - Machinery and Equipmen Warehousing Cost 0.00 0.00 0.00 0.00 0.00 0.00 0.00 0.00 11,363.65 0.00 11,363.65 0.00 11,363.65 0.00 11,363.65 0.00 11,363.65 0.00 22,727.30 3,600.00 22,727.30 3,600.00 22,727.30 3,600.00 22,727.30 3,600.00 22,727.30 3,600.00 34,090.95 8,300.00 34,090.95 8,300.00 34,090.95 8,300.00 34,090.95 8,300.00 34,090.95 8,300.00 45,454.60 11,900.00 45,454.60 11,900.00 45,454.60 11,900.00 45,454.60 11,900.00 45,454.60 11,900.00 56,818.25 13,650.00 56,818.25 13,650.00 56,818.25 13,650.00 56,818.25 13,650.00 56,818.25 13,650.00 68,181.90 14,350.00 Direct Labor Cost Factory Overhead Expense 0.00 0.00 0.00 0.00 0.00 0.00 0.00 0.00 21,120.00 14,400.00 21,120.00 14,400.00 21,120.00 14,400.00 21,120.00 14,400.00 21,120.00 14,400.00 42,240.00 28,800.00 42,240.00 28,800.00 42,240.00 28,800.00 42,240.00 28,800.00 42,240.00 28,800.00 63,360.00 43,200.00 63,360.00 43,200.00 63,360.00 43,200.00 63,360.00 43,200.00 63,360.00 43,200.00 84,480.00 57,600.00 84,480.00 57,600.00 84,480.00 57,600.00 84,480.00 57,600.00 84,480.00 57,600.00 105,600.00 72,000.00 105,600.00 72,000.00 105,600.00 72,000.00 105,600.00 72,000.00 105,600.00 72,000.00 126,720.00 86,400.00 PP 1 16 PP 1 17 PP 1 18 PP 1 19 PP 1 20 PP 1 21 PP 1 22 PP 1 23 PP 1 24 PP 1 25 PP 1 26 PP 1 27 PP 1 28 PP 1 29 PP 1 30 2 3 4 5 6 7 8 9 0 1 2 3 4 5 6 7 7 8 Cost of Goods Manufacturer 0.00 0.00 0.00 0.00 58,247.29 58,247.29 58,247.29 58,247.29 85,442.29 159,120.08 189,822.08 220,524.08 228,386.58 257,702.58 349,267.87 364,669.87 380,192.67 401,979.87 424,407.87 497,656.43 518,861.18 540,065.93 554,688.84 554,688.84 669,076.13 696,271.13 710,468,93 741,170.93 771,872.93 861,522.22 Total Finished Products Sol 0.00 0.00 0.00 0.00 0.00 0.00 0.00 0.00 0.00 55,650.00 66,190.00 76,169.90 87,390.00 116,285.84 148,502.88 164,531.12 164,531.12 164,531.12 190,849.32 291,748.44 400.442.00 506,319.44 527,989.61 536,755.81 548,924.61 598,552.22 658,375.98 665,416.02 720,840.77 788,037.81 Total Finished Products Producer Ending Inventor 0.00 0.00 0.00 0.00 0.00 0.00 0.00 0.00 0.00 0.00 0.00 0.00 0.00 0.00 0.00 0.00 (55,650.00 ) (55,650.00 ) (87,390.00 ) (31,740.00 ) (139,470.00 ) (73,280.00 ) (191,550.00 ) (115,380.10 ) (222,100.00 ) (134,710.00 ) (274,600.00 ) (158,314.16 ) (325,850.00 ) (177,347.12 ) (365,247.50 ) (200,716.38 ) (404,954.00 ) (240,422.88 ) (467,990.00 ) (303,458.88 ) (532,880.00 ) (342,030.68 ) (570,002.50 ) (278,254.06 ) (630,692.50 ) ( (230,250.50 ) (691,382.50 ) (185,063.06 ) (724,889.00 ) (196,899.39 ) (724,889.00 ) (188,133.19 ) (836,189.00 ) (287,264.39 ) (891,839.00 ) (293,286.78 ) (923,086.00 ) (264,710.02 ) (975,166.00 ) (309,749.98 ) (1,027,246.00 ) (306,405.23 ) (1,079,326.00 ) (291,288.19 ) Loss-inventory difference: 0.00 0.00 0.00 0.00 0.00 0.00 0.00 0.00 0.00 0.00 0.00 0.00 0.00 0.00 0.00 0.00 0.00 0.00 0.00 0.00 0.00 0.00 0.00 0.00 0.00 0.00 0.00 0.00 0.00 0.00 Gain-inventory difference: 0.00 0.00 0.00 0.00 0.00 0.00 0.00 0.00 0.00 0.00 0.00 0.00 0.00 0.00 0.00 0.00 0.00 0.00 0.00 0.00 0.00 0.00 0.00 0.00 0.00 0.00 0.00 0.00 0.00 Gain/Loss from valuation of inventory 0.00 0.00 0.00 0.00 0.00 0.00 0.00 0.00 0.00 0.00 0.00 0.00 0.00 0.00 0.00 0.00 0.00 0.00 0.00 0.00 0.00 0.00 0.00 0.00 0.00 0.00 0.00 0.00 0.00 0.00 Cost of Goods Sol 0.00 0.00 0.00 0.00 58,247.29 58,247.29 58,247.29 58,247.29 29,792.29 127,380.08 116,542.08 105,143.98 93,676.58 99,388.42 171,920.75 163,953.49 139,769.79 98,520.99 82,377.19 219,402.37 288,610.68 355,002.87 357,789.45 366,555.65 381,811.74 402,984.35 445,758.91 431,420.95 465,467.70 570,234.03 SG&A 0.00 0.00 0.00 0.00 46,400.00 46,400.00 46,400.00 46,400.00 46,400.00 92,800.00 92,800.00 92,800.00 92,800.00 92,800.00 139,200.00 139,200.00 139,200.00 139,200.00 139,200.00 185,600.00 185,600.00 185,600.00 185,600.00 185,600.00 232,000.00 232,000.00 232,000.00 232,000.00 232,000.00 278,400.00 Lean Manufacturing Program Expense: 62,500.00 62,500.00 62,500.00 62,500.00 62,500.00 62,500.00 62,500.00 62,500.00 62,500.00 62,500.00 62,500.00 62,500.00 62,500.00 62,500.00 62,500.00 62,500.00 62,500.00 62,500.00 62,500.00 62,500.00 62,500.00 62,500.00 62,500.00 62,500.00 62,500.00 62,500.00 62,500.00 62,500.00 62,500.00 62,500.00 9 0 1 2 3 4 5 6 7 8 9 0 1 0.00 Quarter TT Day Company Cody PP 1 1 PP 1 2 PP 1 3 PP 1 4 PP 1 5 PP 1 6 1 PP PP 7 8 1 PP 1 9 PP 1 10 PP 1 11 PP 12 1 1 PP 13 PP 1 14 PP 1 15 Sales Revenues - Domesti Revenues - 0.00 0.00 0.00 0.00 0.00 0.00 0.00 0.00 0.00 0.00 0.00 0.00 0.00 0.00 0.00 0.00 0.00 0.00 (95,525.50 ) (95,525.50 ) (123,150.50 ) (123,150.50 ) (146,311.40 ) (146,311.40 ) (172,251.65 ) (172,251.65 ) (247,279.60 ) (247,279.60 ) (332,817.10 ) (332,817.10 ) (376,442.35 ) (376,442.35 ) (376,442.35 ) (376,442.35 ) (376,442.35 ) (376,442.35 ) (432,964.85 ) (432,964.85 ) (631,609.10 ) (631,609.10 ) (837,353.85 ) (837,353.85 ) (1,034,236.60 ) (1,034,236.60 ) (1,074,561.35 ) (1,074,561.35 ) (1,093,582.35 ) (1,093,582.35 ) (1,119,986.35 ) (1,119,986.35 ) (1,219,560.85 ) (1,219,560.85 ) (1,339,171.85 ) (1,339,171.85 ) (1,351,960.85 ) (1,351,960.85 ) (1,468,034.10 ) (1,468,034.10 ) (1,605,620.35 ) (1,605,620.35 ) Consumption Raw Material Depreciation Expenses - Buildin 0.00 0.00 0.00 0.00 0.00 0.00 0.00 0.00 0.00 11,363.64 0.00 11,363.64 0.00 11,363.64 0.00 11,363.64 27,195.00 11,363.64 39,025.50 22,727.28 69,727.50 22,727.28 100,429.50 22,727.28 108,292.00 22,727.28 137,608.00 22,727.28 166,226.00 34,090.92 181,628.00 34,090.92 197,150.80 34,090.92 218,938.00 34,090.92 241,366.00 34,090.92 252,767.27 45,454.56 273,972.02 45,454.56 295,176.77 45,454.56 309,799.68 45,454.56 309,799.68 45,454.56 364,189.68 56,818.20 391,384.68 56,818.20 405,582.48 56,818.20 436,284.48 56,818.20 466,986.48 56,818.20 497,688.48 68,181.84 Depreciation Expenses - Machinery and Equipmen Warehousing Cost 0.00 0.00 0.00 0.00 0.00 0.00 0.00 0.00 11,363.65 0.00 11,363.65 0.00 11,363.65 0.00 11,363.65 0.00 11,363.65 0.00 22,727.30 3,600.00 22,727.30 3,600.00 22,727.30 3,600.00 22,727.30 3,600.00 22,727.30 3,600.00 34,090.95 8,300.00 34,090.95 8,300.00 34,090.95 8,300.00 34,090.95 8,300.00 34,090.95 8,300.00 45,454.60 11,900.00 45,454.60 11,900.00 45,454.60 11,900.00 45,454.60 11,900.00 45,454.60 11,900.00 56,818.25 13,650.00 56,818.25 13,650.00 56,818.25 13,650.00 56,818.25 13,650.00 56,818.25 13,650.00 68,181.90 14,350.00 Direct Labor Cost Factory Overhead Expense 0.00 0.00 0.00 0.00 0.00 0.00 0.00 0.00 21,120.00 14,400.00 21,120.00 14,400.00 21,120.00 14,400.00 21,120.00 14,400.00 21,120.00 14,400.00 42,240.00 28,800.00 42,240.00 28,800.00 42,240.00 28,800.00 42,240.00 28,800.00 42,240.00 28,800.00 63,360.00 43,200.00 63,360.00 43,200.00 63,360.00 43,200.00 63,360.00 43,200.00 63,360.00 43,200.00 84,480.00 57,600.00 84,480.00 57,600.00 84,480.00 57,600.00 84,480.00 57,600.00 84,480.00 57,600.00 105,600.00 72,000.00 105,600.00 72,000.00 105,600.00 72,000.00 105,600.00 72,000.00 105,600.00 72,000.00 126,720.00 86,400.00 PP 1 16 PP 1 17 PP 1 18 PP 1 19 PP 1 20 PP 1 21 PP 1 22 PP 1 23 PP 1 24 PP 1 25 PP 1 26 PP 1 27 PP 1 28 PP 1 29 PP 1 30


