

Question: What was the average first-day return on IPOs for the period 1980?2015 in the United States? TABLE 19.3 Average First-Day Returns, Categorized by Sales, for
What was the average first-day return on IPOs for the period 1980?2015 in the United States?
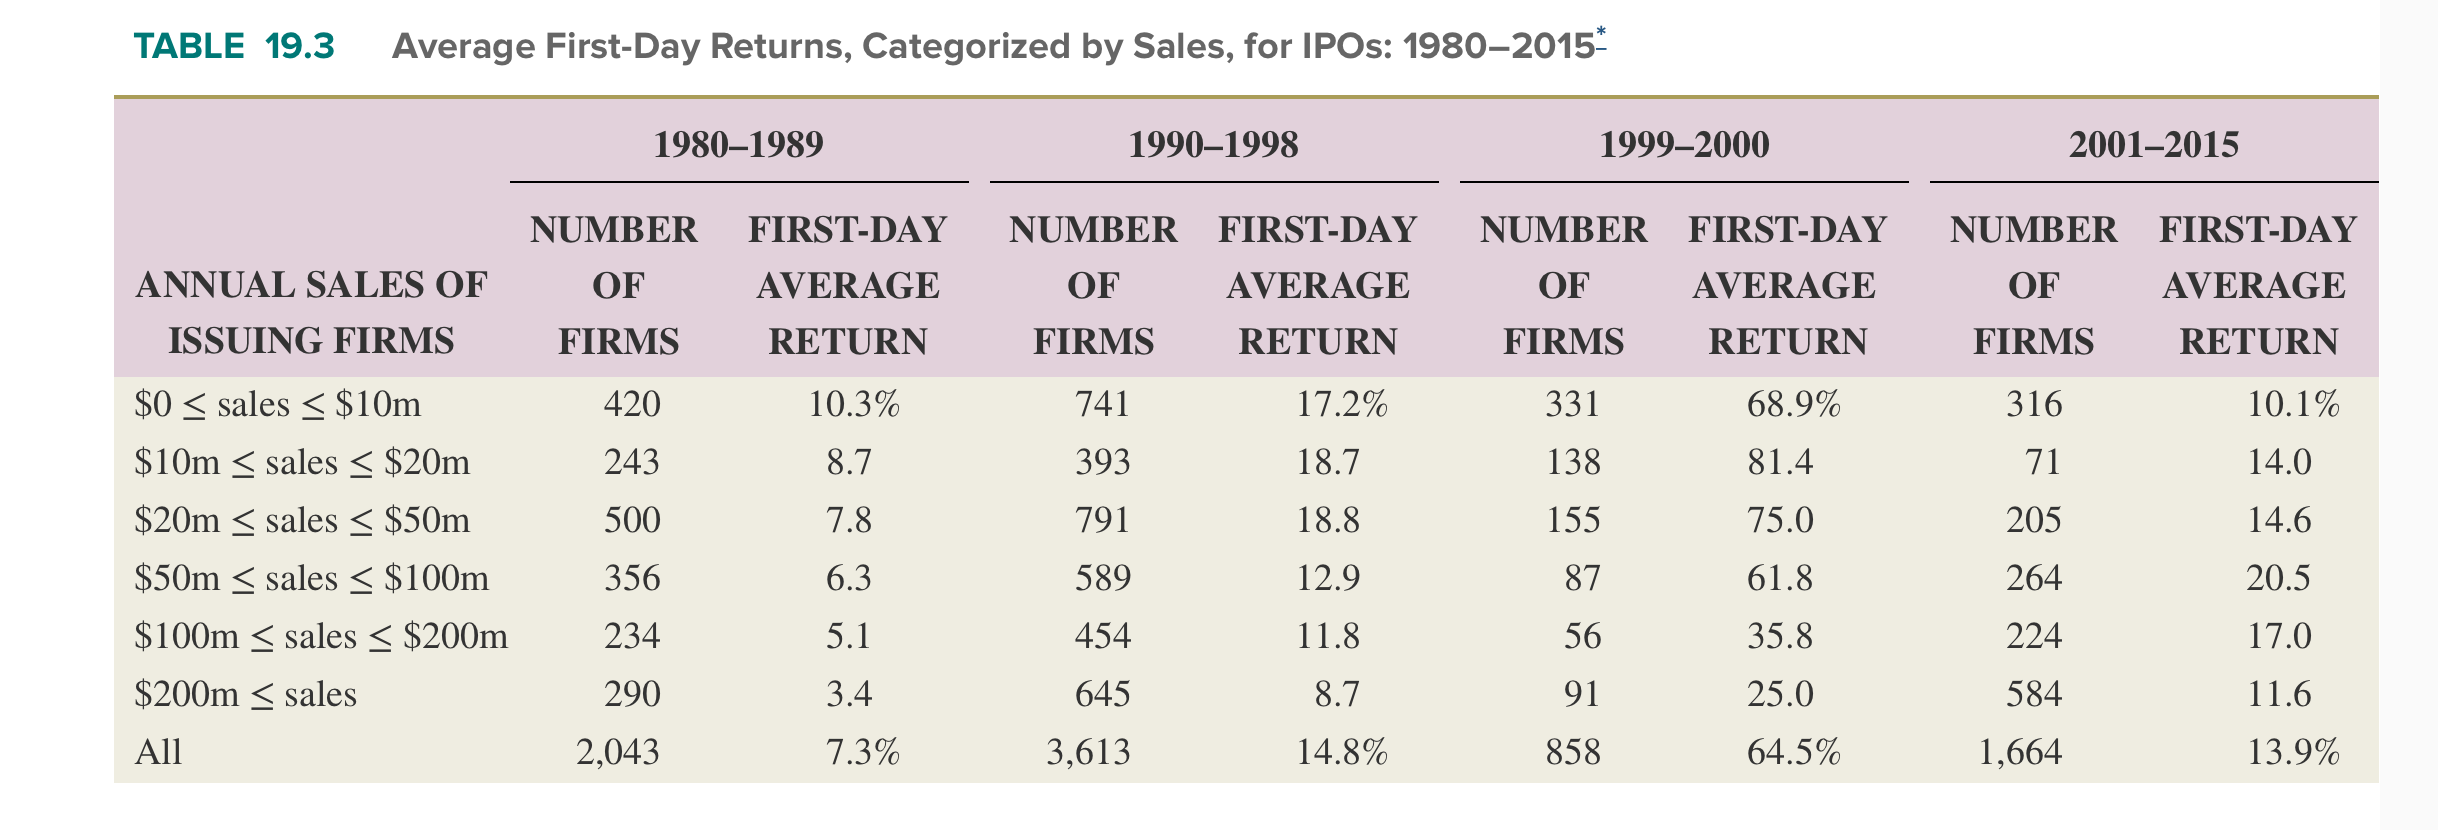
TABLE 19.3 Average First-Day Returns, Categorized by Sales, for IPOs: 1980-2015- 1980-1989 1990-1998 1999-2000 2001-2015 NUMBER ANNUAL SALES OF ISSUING FIRMS OF FIRMS OF FIRMS $0 sales < $10m 420 741 FIRST-DAY NUMBER FIRST-DAY NUMBER AVERAGE RETURN 10.3% AVERAGE RETURN OF FIRMS FIRST-DAY AVERAGE RETURN NUMBER FIRST-DAY OF FIRMS AVERAGE RETURN 17.2% 331 68.9% 316 10.1% $10m sales < $20m 243 8.7 393 18.7 138 81.4 71 14.0 $20m sales < $50m 500 7.8 791 18.8 155 75.0 205 14.6 $50m sales < $100m 356 6.3 589 12.9 87 61.8 264 20.5 $100m sales < $200m 234 5.1 454 11.8 56 35.8 224 17.0 $200m sales 290 3.4 645 8.7 91 25.0 584 11.6 All 2,043 7.3% 3,613 14.8% 858 64.5% 1,664 13.9%
Step by Step Solution
There are 3 Steps involved in it
the average firstday return on IPOs for all firms duri... View full answer

Get step-by-step solutions from verified subject matter experts