

Question: What would be a reasonable Average Product Life (APL) for the Smartphone industry? Why did you choose that APL? What happens when the APL is
What would be a reasonable Average Product Life (APL) for the Smartphone industry?
Why did you choose that APL?
What happens when the APL is changed? I am asking you to explain the data you see in your graph as opposed to what the graph looked like when you download the model and ran it without any changes.
What is the Equation and Unit for Discard Rate in your modified model?
Paste the graph showing Potential Adopters and Adopters into your document.
Create another graph showing Adoption Rate and Discard Rate on one chart. Paste it into the document.
Give one example of a product where this model structure might apply (other than smartphone). 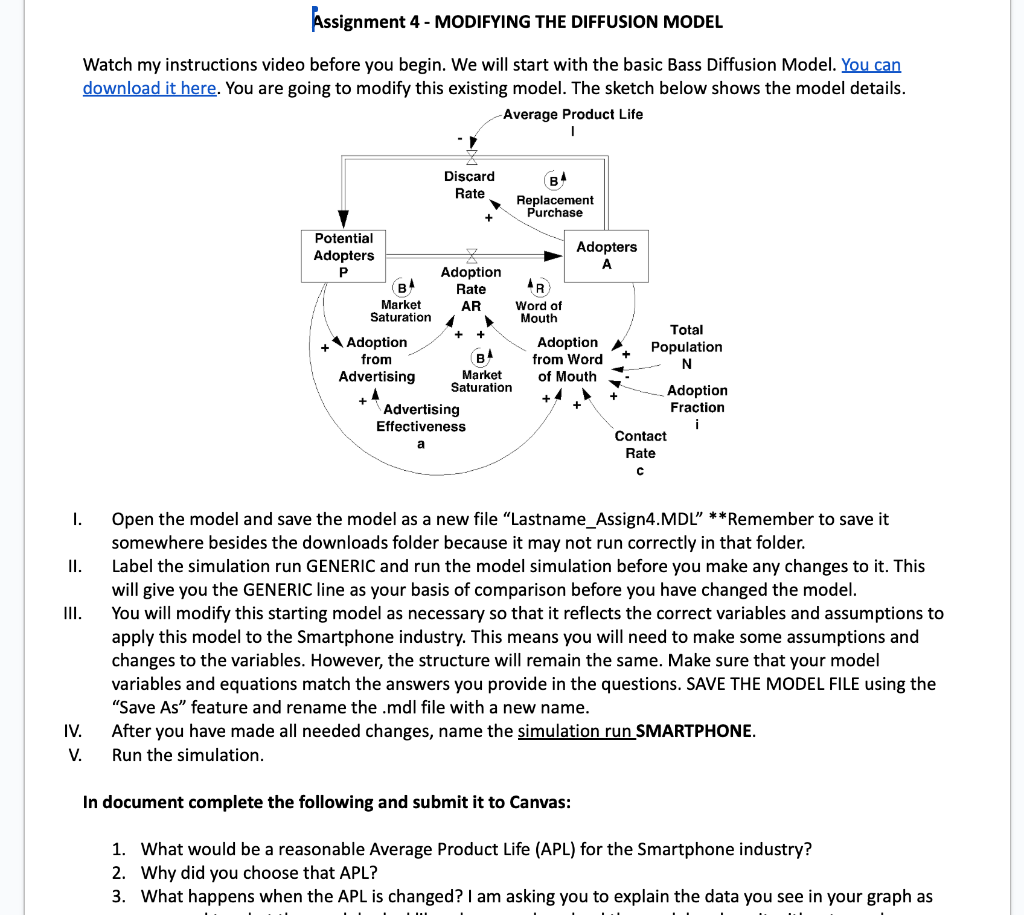
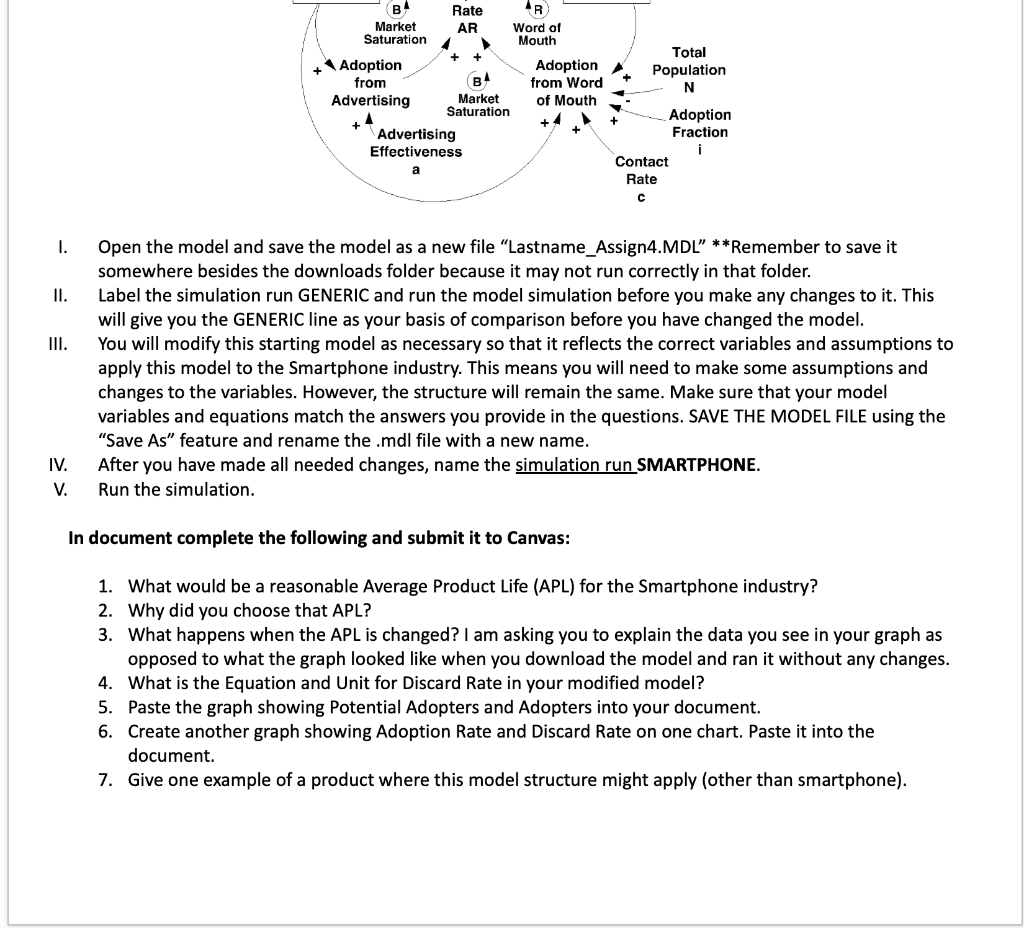
Watch my instructions video before you begin. We will start with the basic Bass Diffusion Model. You can You are going to modify this existing model. The sketch below shows the model details. I. Open the model and save the model as a new file "Lastname_Assign4.MDL" **Remember to save it somewhere besides the downloads folder because it may not run correctly in that folder. II. Label the simulation run GENERIC and run the model simulation before you make any changes to it. This will give you the GENERIC line as your basis of comparison before you have changed the model. III. You will modify this starting model as necessary so that it reflects the correct variables and assumptions to apply this model to the Smartphone industry. This means you will need to make some assumptions and changes to the variables. However, the structure will remain the same. Make sure that your model variables and equations match the answers you provide in the questions. SAVE THE MODEL FILE using the "Save As" feature and rename the .mdl file with a new name. IV. After you have made all needed changes, name the simulation run SMARTPHONE. V. Run the simulation. In document complete the following and submit it to Canvas: 1. What would be a reasonable Average Product Life (APL) for the Smartphone industry? 2. Why did you choose that APL? 3. What happens when the APL is changed? I am asking you to explain the data you see in your graph as I. Open the model and save the model as a new file "Lastname_Assign4.MDL" ***emember to save it somewhere besides the downloads folder because it may not run correctly in that folder. II. Label the simulation run GENERIC and run the model simulation before you make any changes to it. This will give you the GENERIC line as your basis of comparison before you have changed the model. III. You will modify this starting model as necessary so that it reflects the correct variables and assumptions to apply this model to the Smartphone industry. This means you will need to make some assumptions and changes to the variables. However, the structure will remain the same. Make sure that your model variables and equations match the answers you provide in the questions. SAVE THE MODEL FILE using the "Save As" feature and rename the .mdl file with a new name. IV. After you have made all needed changes, name the simulation run SMARTPHONE. V. Run the simulation. In document complete the following and submit it to Canvas: 1. What would be a reasonable Average Product Life (APL) for the Smartphone industry? 2. Why did you choose that APL? 3. What happens when the APL is changed? I am asking you to explain the data you see in your graph as opposed to what the graph looked like when you download the model and ran it without any changes. 4. What is the Equation and Unit for Discard Rate in your modified model? 5. Paste the graph showing Potential Adopters and Adopters into your document. 6. Create another graph showing Adoption Rate and Discard Rate on one chart. Paste it into the document. 7. Give one example of a product where this model structure might apply (other than smartphone). Watch my instructions video before you begin. We will start with the basic Bass Diffusion Model. You can You are going to modify this existing model. The sketch below shows the model details. I. Open the model and save the model as a new file "Lastname_Assign4.MDL" **Remember to save it somewhere besides the downloads folder because it may not run correctly in that folder. II. Label the simulation run GENERIC and run the model simulation before you make any changes to it. This will give you the GENERIC line as your basis of comparison before you have changed the model. III. You will modify this starting model as necessary so that it reflects the correct variables and assumptions to apply this model to the Smartphone industry. This means you will need to make some assumptions and changes to the variables. However, the structure will remain the same. Make sure that your model variables and equations match the answers you provide in the questions. SAVE THE MODEL FILE using the "Save As" feature and rename the .mdl file with a new name. IV. After you have made all needed changes, name the simulation run SMARTPHONE. V. Run the simulation. In document complete the following and submit it to Canvas: 1. What would be a reasonable Average Product Life (APL) for the Smartphone industry? 2. Why did you choose that APL? 3. What happens when the APL is changed? I am asking you to explain the data you see in your graph as I. Open the model and save the model as a new file "Lastname_Assign4.MDL" ***emember to save it somewhere besides the downloads folder because it may not run correctly in that folder. II. Label the simulation run GENERIC and run the model simulation before you make any changes to it. This will give you the GENERIC line as your basis of comparison before you have changed the model. III. You will modify this starting model as necessary so that it reflects the correct variables and assumptions to apply this model to the Smartphone industry. This means you will need to make some assumptions and changes to the variables. However, the structure will remain the same. Make sure that your model variables and equations match the answers you provide in the questions. SAVE THE MODEL FILE using the "Save As" feature and rename the .mdl file with a new name. IV. After you have made all needed changes, name the simulation run SMARTPHONE. V. Run the simulation. In document complete the following and submit it to Canvas: 1. What would be a reasonable Average Product Life (APL) for the Smartphone industry? 2. Why did you choose that APL? 3. What happens when the APL is changed? I am asking you to explain the data you see in your graph as opposed to what the graph looked like when you download the model and ran it without any changes. 4. What is the Equation and Unit for Discard Rate in your modified model? 5. Paste the graph showing Potential Adopters and Adopters into your document. 6. Create another graph showing Adoption Rate and Discard Rate on one chart. Paste it into the document. 7. Give one example of a product where this model structure might apply (other than smartphone)
Step by Step Solution
There are 3 Steps involved in it

Get step-by-step solutions from verified subject matter experts