

Question: What would be the matlab commands to do these tasks? The file for this data is siro2.csv. Load the data into MATLAB using the command
What would be the matlab commands to do these tasks?
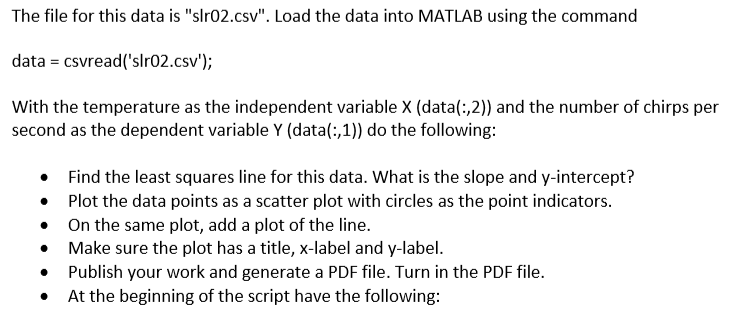
The file for this data is "siro2.csv". Load the data into MATLAB using the command data = csvread('siro2.csv'); With the temperature as the independent variable X (data(:,2)) and the number of chirps per second as the dependent variable Y (data(:,1)) do the following: Find the least squares line for this data. What is the slope and y-intercept? Plot the data points as a scatter plot with circles as the point indicators. On the same plot, add a plot of the line. Make sure the plot has a title, x-label and y-label. Publish your work and generate a PDF file. Turn in the PDF file. At the beginning of the script have the following
Step by Step Solution
There are 3 Steps involved in it

Get step-by-step solutions from verified subject matter experts