

Question: What's the answer for question B K- The accompanying scatterplot shows the size (in square feet) and selling prices for homes in a certain zip
What's the answer for question B
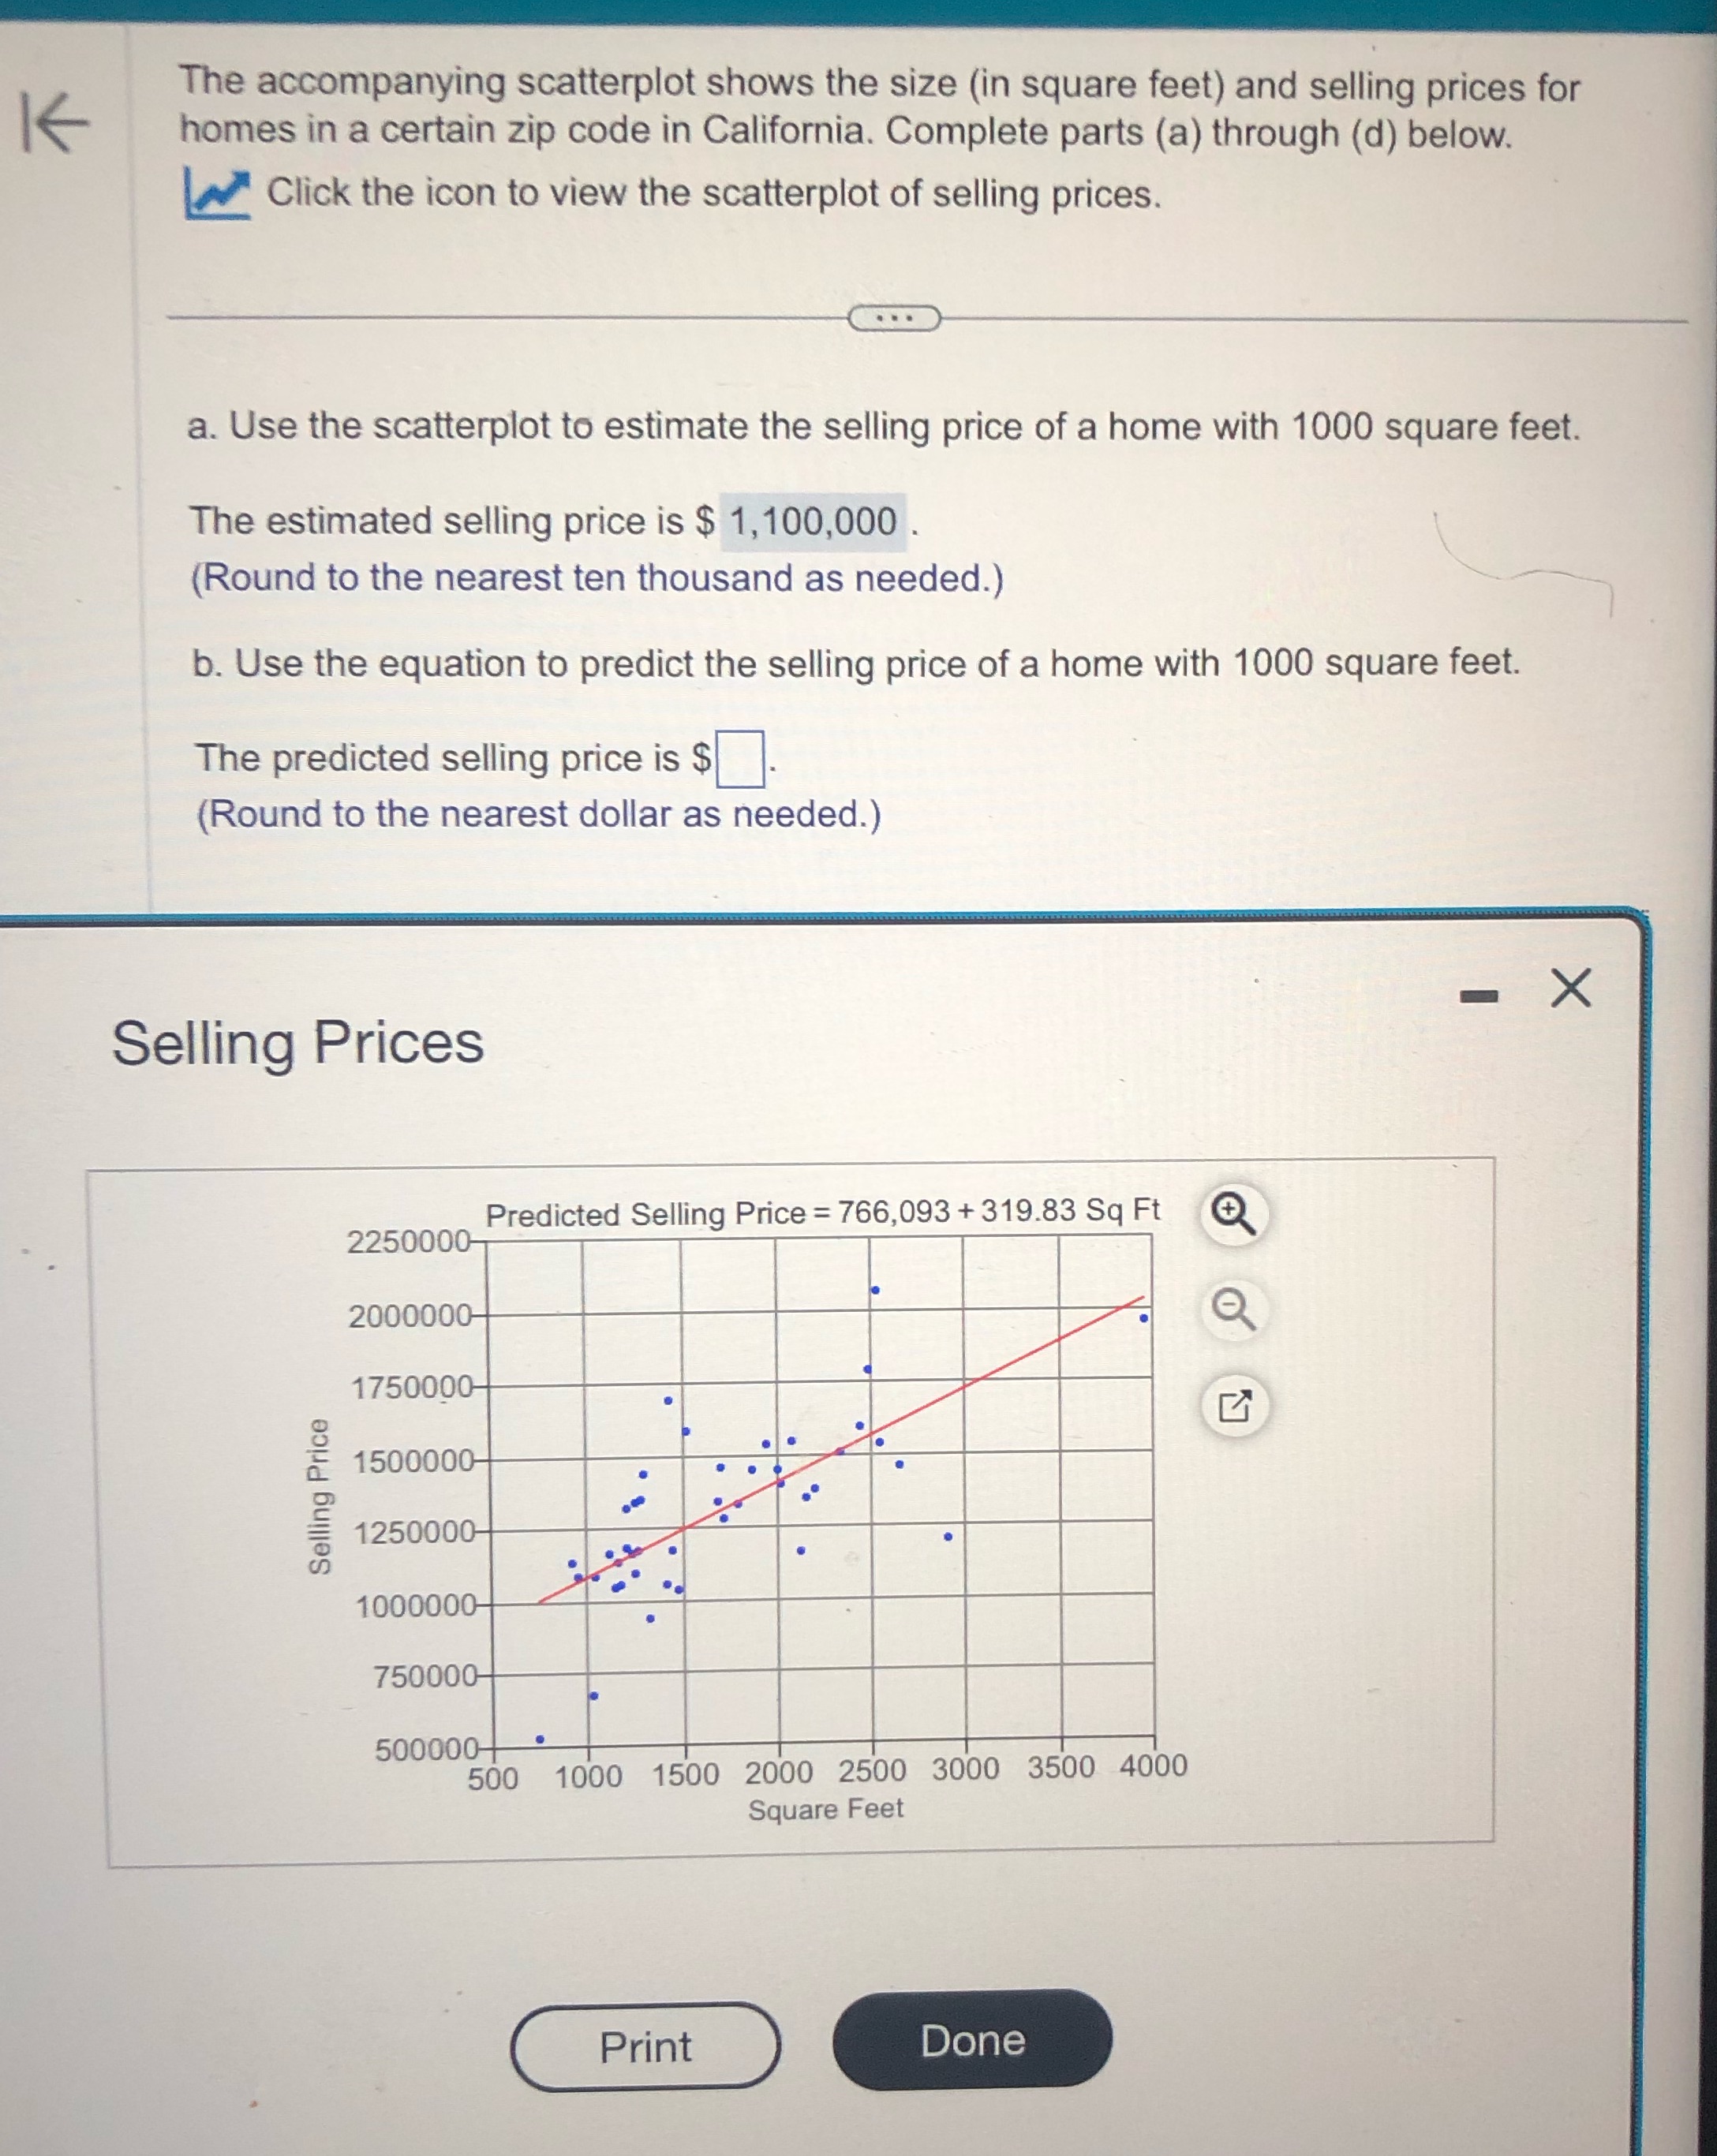
K- The accompanying scatterplot shows the size (in square feet) and selling prices for homes in a certain zip code in California. Complete parts (a) through (d) below. K Click the icon to view the scatterplot of selling prices. E} a. Use the scatterplot to estimate the selling price of a home with 1000 square feet. The estimated selling price is $ 1,100,000 . (Round to the nearest ten thousand as needed.) b. Use the equation to predict the selling price of a home with 1000 square feet. The predicted selling price is $D. (Round to the nearest dollar as needed.) Selling Prices 225000. 200000 Q 175000. E3 Selling Price 500 1000 1500 2000 2500 3000 3500 4000 Square Feet l_.__.h_.s
Step by Step Solution
There are 3 Steps involved in it

Get step-by-step solutions from verified subject matter experts