

Question: The scatterplot shows the size (in square feet) and selling prices for homes in a certain zip code in California. a. Use the graph to
The scatterplot shows the size (in square feet) and selling prices for homes in a certain zip code in California.
a. Use the graph to estimate the selling price of a home with 2000 square feet.
b. Use the equation to predict the selling price for a home with 2000 square feet.
c. What is the slope of the regression equation? Interpret the slope of the regression equation.
d. What is the y-intercept of the regression equation? Interpret the y-intercept of the regression equation or explain why it would be inappropriate to do so.
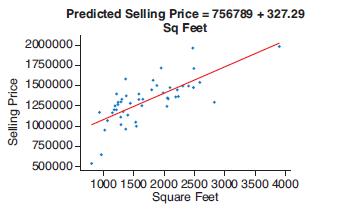
Predicted Selling Price = 756789 + 327.29 Sq Feet 2000000- 1750000- 1500000- 1250000- 1000000- 750000- 500000 1000 1500 2000 2500 3000 3500 4000 Square Feet Selling Price
Step by Step Solution
3.39 Rating (168 Votes )
There are 3 Steps involved in it
Since I cannot process actual images Ill guide you in how you would generally approach each of these questions using a scatterplot and linear regressi... View full answer

Get step-by-step solutions from verified subject matter experts