

Question: What's the answer for question C I6 The accompanying scatterplot shows the size (in square feet) and selling prices for . i ' i :
What's the answer for question C
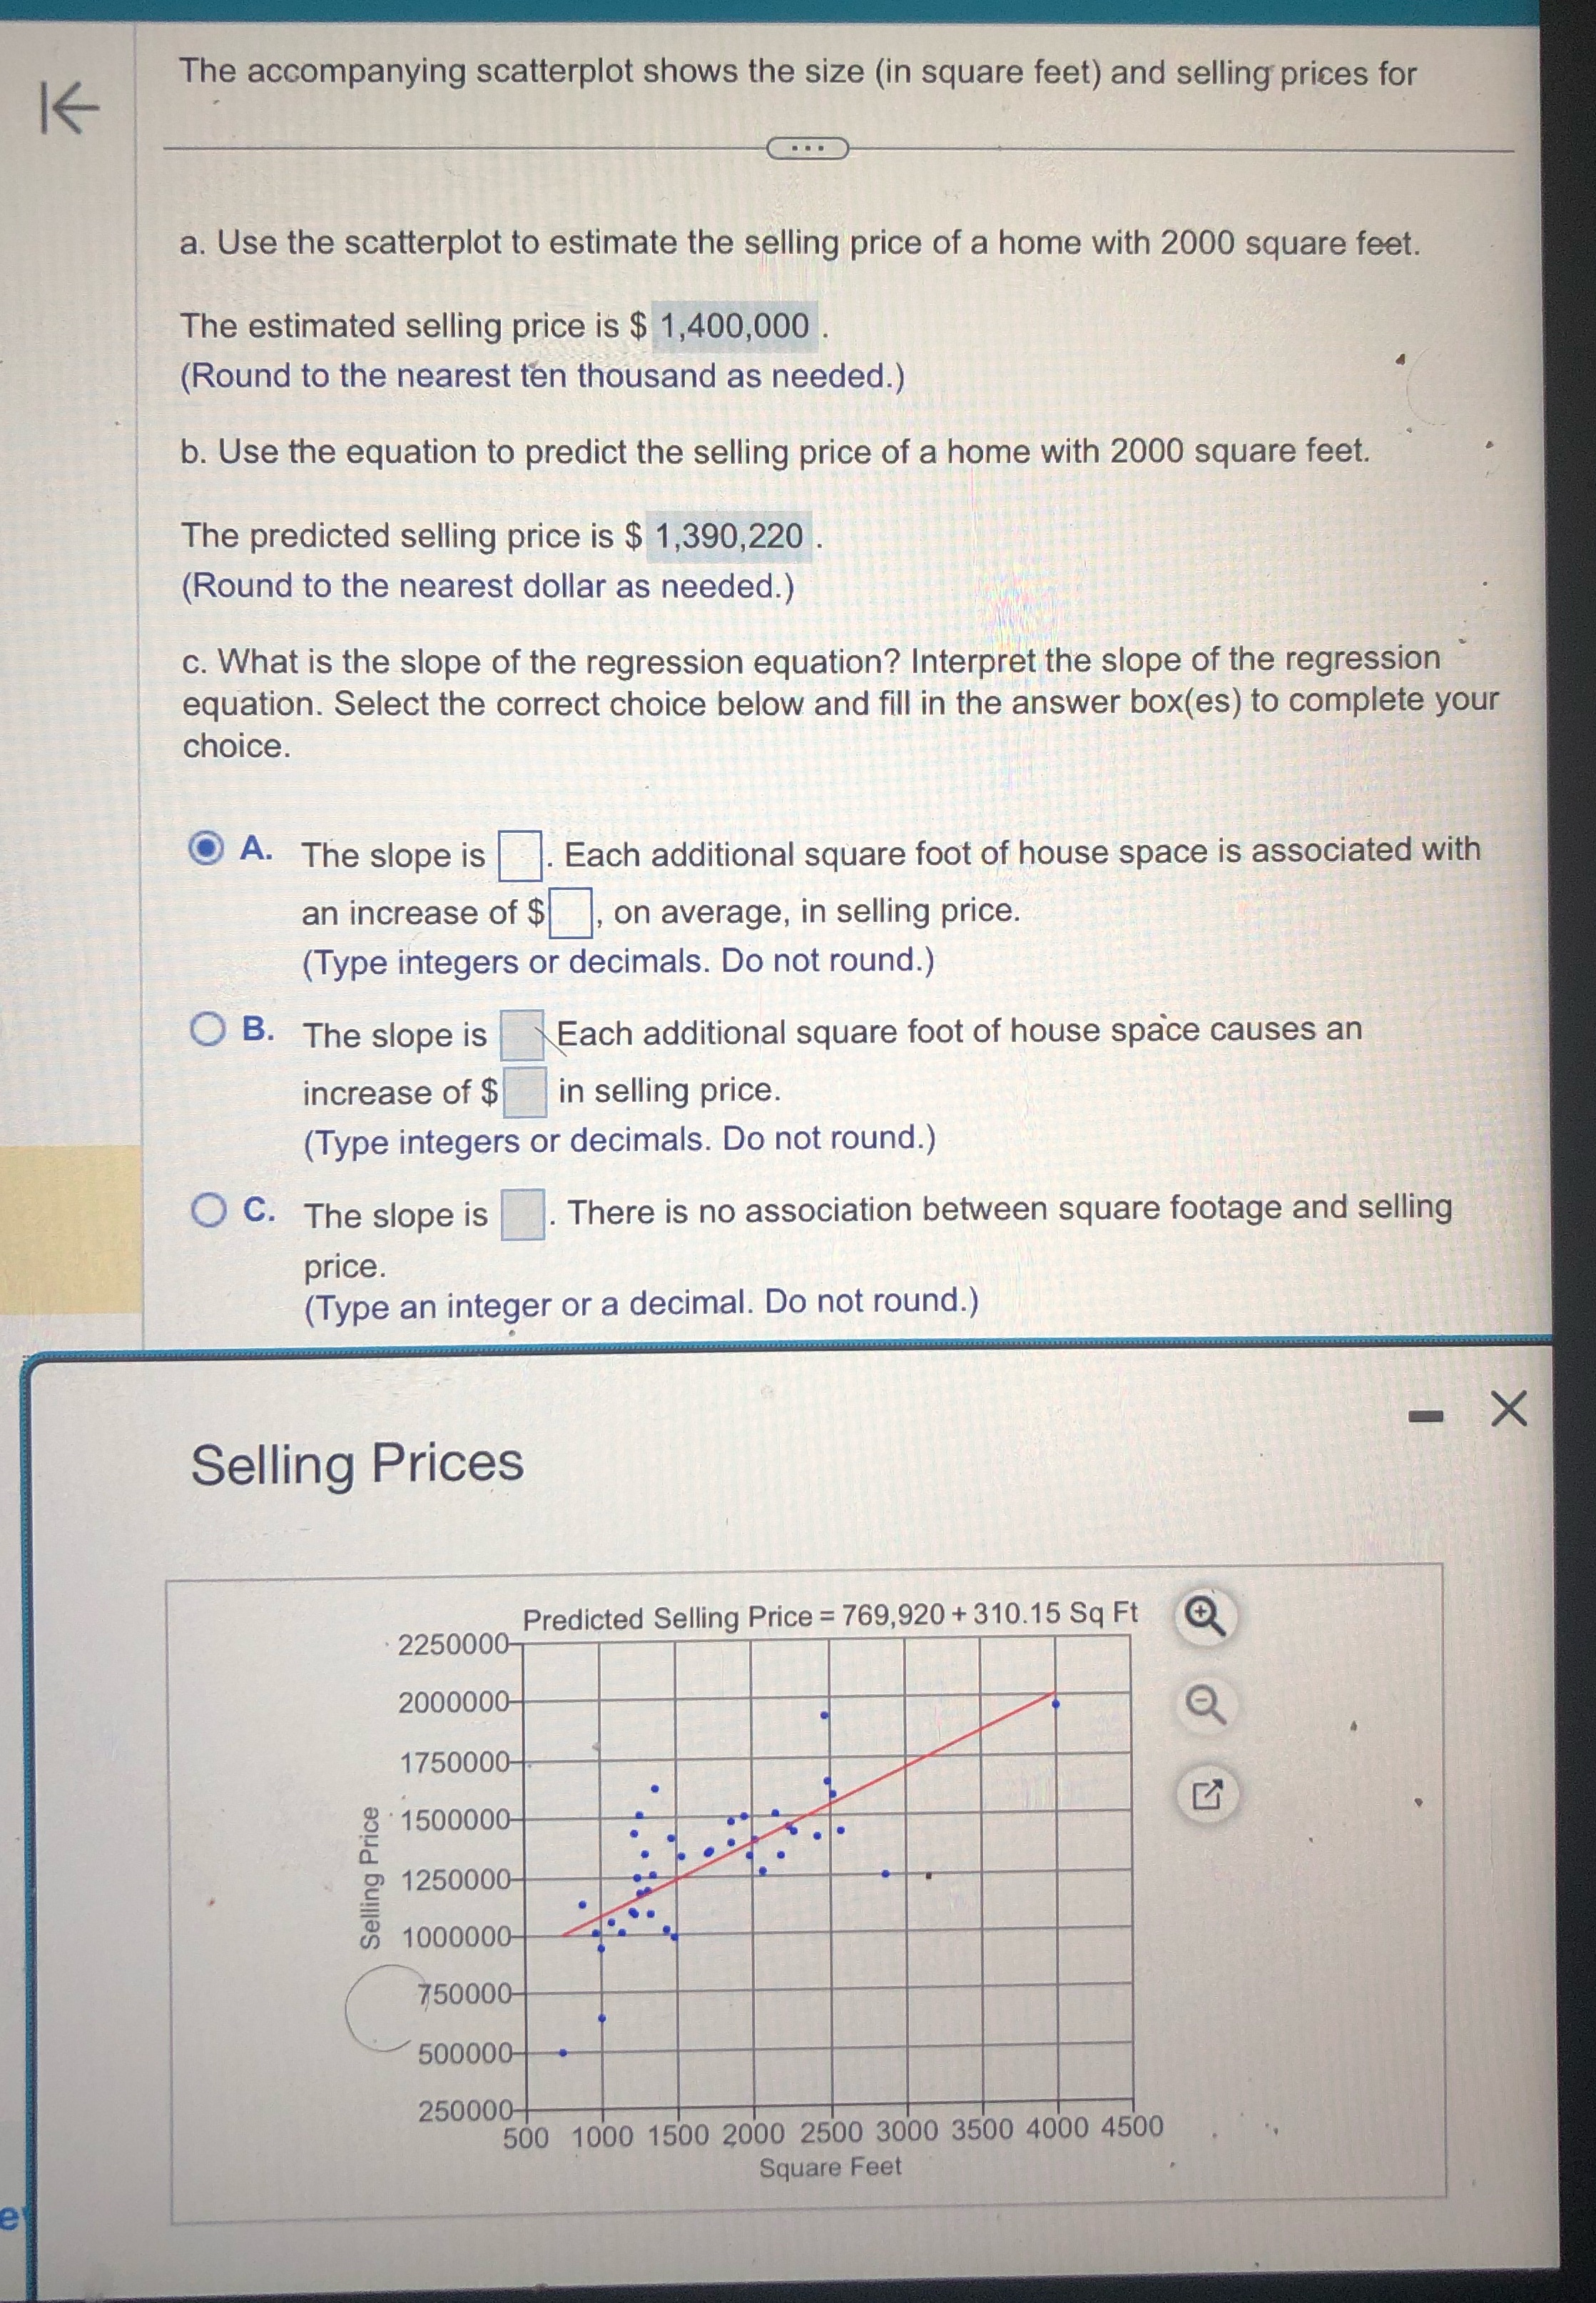
I6 The accompanying scatterplot shows the size (in square feet) and selling prices for . i ' i : E>~~' a. Use the scatterplot to estimate the selling price of a home with 2000 square feet. ,4 The estimated selling price is $ 1,400,000 . (Round to the nearest fen thousand as needed.) b. Use the equation to predict the selling price of a home with 2000 square feet. ' I f The predicted selling price is $ 1,390,220 . (Round to the nearest dollar as needed.) 0. What is the slope of the regression equation? Interpret the slope of the regression " ; equation. Select the correct choice below and fill in the answer box(es) to complete your choice. @ A- The slope is B. Each additional square foot of house space is associated with an increase of $l:], on average, in selling price. (Type integers or decimals. Do not round.) 0 B- The slope is iiiliach additional square foot of house spa'ce causes an increase of $. 1 in selling price. (Type integers or decimals. Do not round.) 0 C- The slope is . There is no association between square footage and selling price. (Type an integer or a decimal. Do not round.) 175000- '150000l 1250000 0 .2 ._ D. on .E
Step by Step Solution
There are 3 Steps involved in it

Get step-by-step solutions from verified subject matter experts