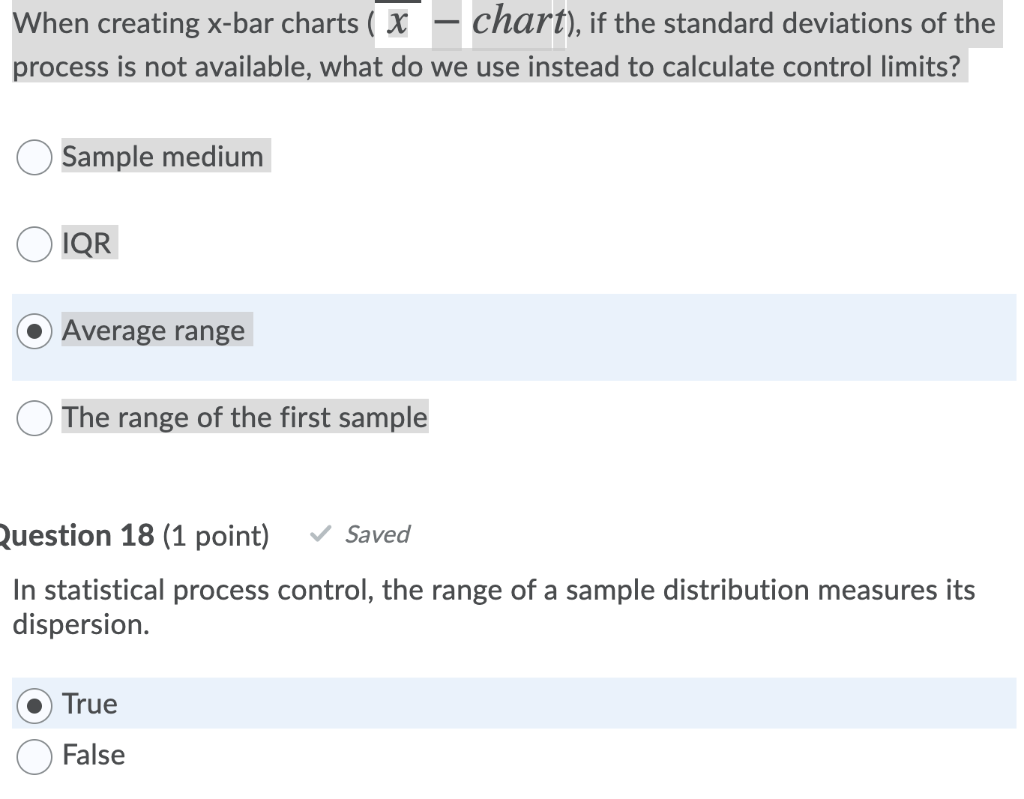
Question: When creating x-bar charts ( x - chart), if the standard deviations of the process is not available, what do we use instead to calculate

When creating x-bar charts ( x - chart), if the

When creating x-bar charts ( x - chart), if the standard deviations of the process is not available, what do we use instead to calculate control limits? Sample medium IQR Average range The range of the first sample Question 18 (1 point) Saved In statistical process control, the range of a sample distribution measures its dispersion. True False

Step by Step Solution

There are 3 Steps involved in it

1 Expert Approved Answer
Step: 1 Unlock blur-text-image
Question Has Been Solved by an Expert!

Get step-by-step solutions from verified subject matter experts

Step: 2 Unlock
Step: 3 Unlock

Students Have Also Explored These Related General Management Questions!