

Question: When you use R to perform any analyses to answer questions in the Exam, please providethe R output (statistical output or graphs) as a part
When you use R to perform any analyses to answer questions in the Exam, please providethe R output (statistical output or graphs) as a part of your answer. If not explicitly indicated in the problem, assume significance level (?) of 0.05
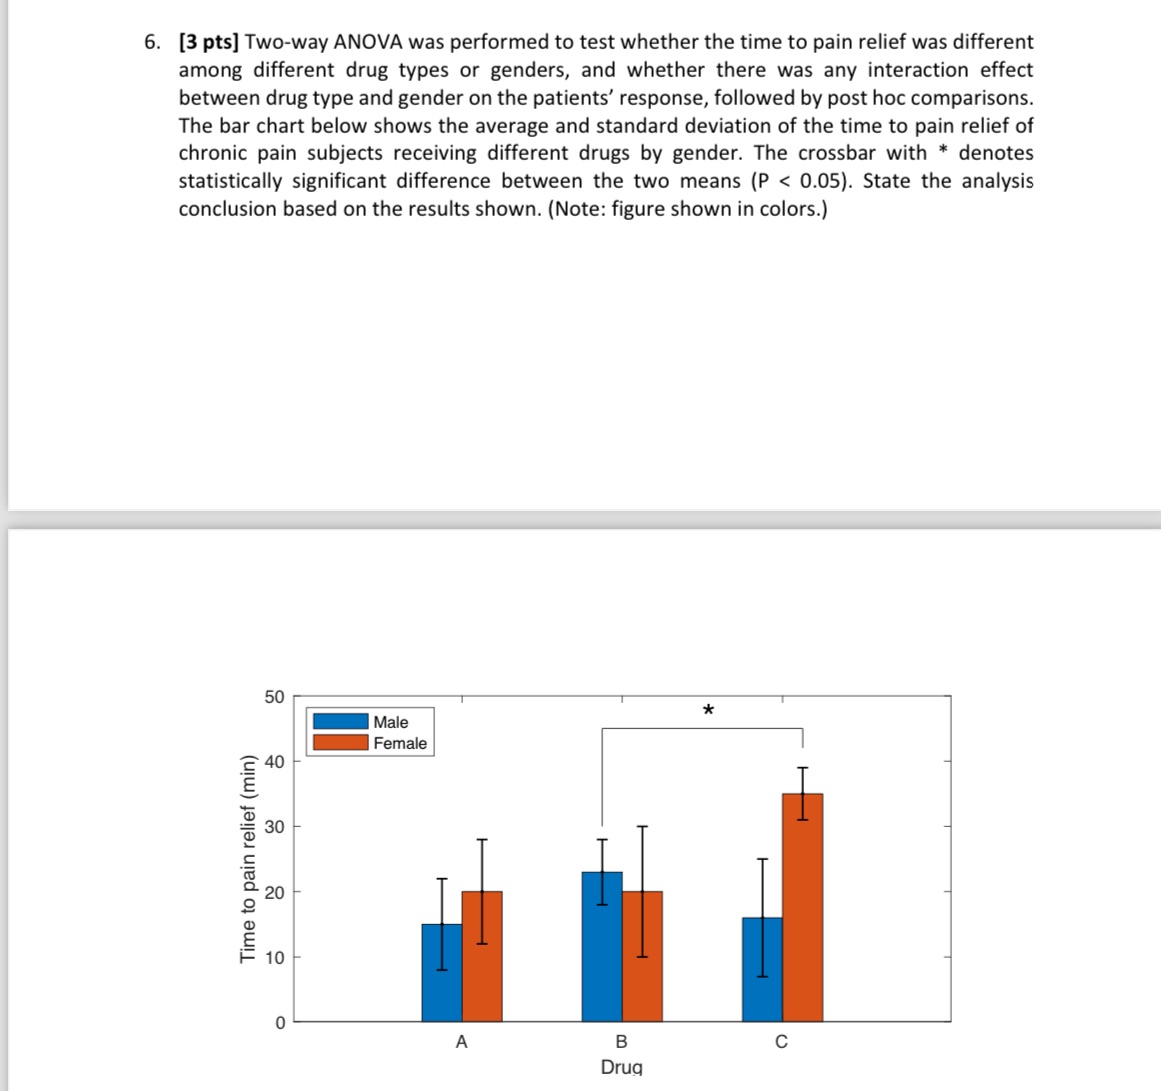
6. [3 pts] Two-way ANOVA was performed to test whether the time to pain relief was different among different drug types or genders, and whether there was any interaction effect between drug type and gender on the patients' response, followed by post hoc comparisons. The bar chart below shows the average and standard deviation of the time to pain relief of chronic pain subjects receiving different drugs by gender. The crossbar with * denotes statistically significant difference between the two means (P
Step by Step Solution
There are 3 Steps involved in it

Get step-by-step solutions from verified subject matter experts