

Question: When you use R to perform any analyses to answer questions in the Exam, please providethe R output (statistical output or graphs) as a part
When you use R to perform any analyses to answer questions in the Exam, please providethe R output (statistical output or graphs) as a part of your answer. If not explicitly indicated in the problem, assume significance level (?) of 0.05
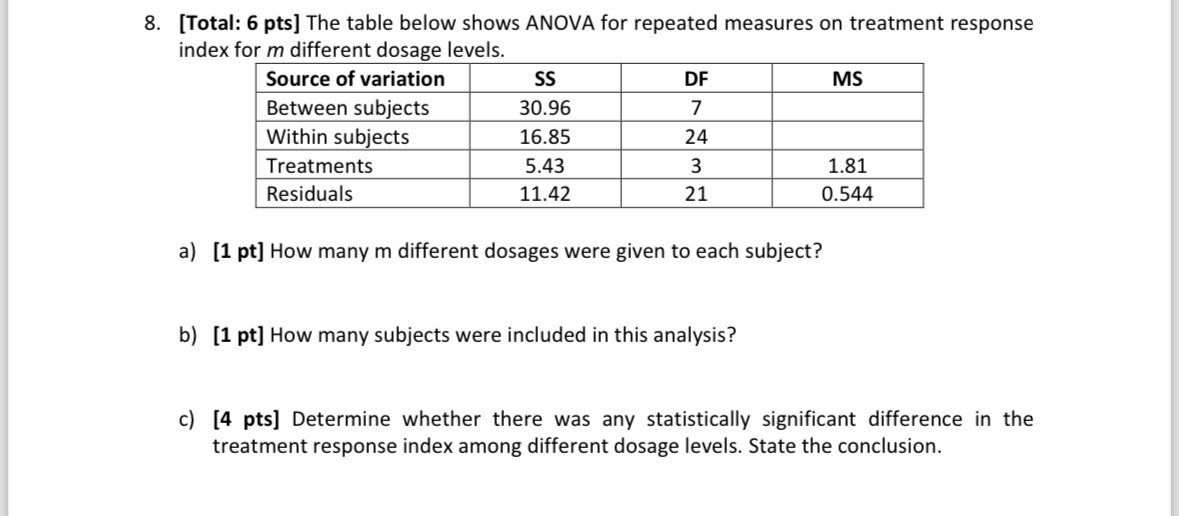
8. [Total: 6 pts] The table below shows ANOVA for repeated measures on treatment response index for m different dosage levels. Source of variation SS DF MS Between subjects 30.96 7 Within subjects 16.85 24 Treatments 5.43 3 1.81 Residuals 11.42 21 0.544 a) [1 pt] How many m different dosages were given to each subject? b) [1 pt] How many subjects were included in this analysis? c) [4 pts] Determine whether there was any statistically significant difference in the treatment response index among different dosage levels. State the conclusion
Step by Step Solution
There are 3 Steps involved in it

Get step-by-step solutions from verified subject matter experts