

Question: Which forecast error measure do you recommend for this problem? Why? Use the static method to forecast demand for years 6 to 8. ME AND
- Which forecast error measure do you recommend for this problem? Why?
- Use the static method to forecast demand for years 6 to 8.
ME AND MY FRIEND WILL UPVOTE IF YOU ANSWER CORRECTLY!!!!!! The questions must be completed in Microsoft Excel. Please send excel screenshots. Answers to the questions must be written in a separate worksheet tab. Plz answer at A AND B CORRECTLY DO NOT COPY FROM OTHER CHEGG ANSWERS and don't copy from the internet or other chegg answers. And show the equations you used on excel and explain the answers.
Jilly Julian had a lot on her mind when she left the conference room at ABC. Her divisional manager had informed her that she would be assigned to a team consisting of SPSs marketing vice president and several staff members from their key customers. The goal of this team was to improve supply chain performance, as ABC had been unable to meet all the demand of their customers over the past several years. This often left ABCs customers scrambling to meet new client demands. Jilly had little contact with ABCs customers and wondered how she would add value to this process. She was told by her division manager that the teams first task was to establish a collaborative forecast using data from both ABC and their customers. This forecast would serve as the basis for improving their performance as they could use this more accurate forecast for their production planning. With this in place, ABC would have a key tool to improve delivery performance.
ABC
ABC turns polystyrene resin into recyclable /disposable containers for the food industry. Polystyrene is purchased as a commodity in the form of resin pellets. The resin is unloaded from bulk rail containers or overland trailers into storage silos. Making the food containers is a two step process. First, resin is conveyed to an extruder, which converts it into polystyrene sheet wound into rolls. The plastic comes in two forms clear and black. The rolls are either used immediately to make containers or are put into storage. Second, the rolls are loaded onto thermoforming presses, which from the sheet into containers and trim the containers from the sheet. The two manufacturing steps are shown in the below figure.
Resin Storage -> Extruder -> Roll Storage -> Thermo-forming Press
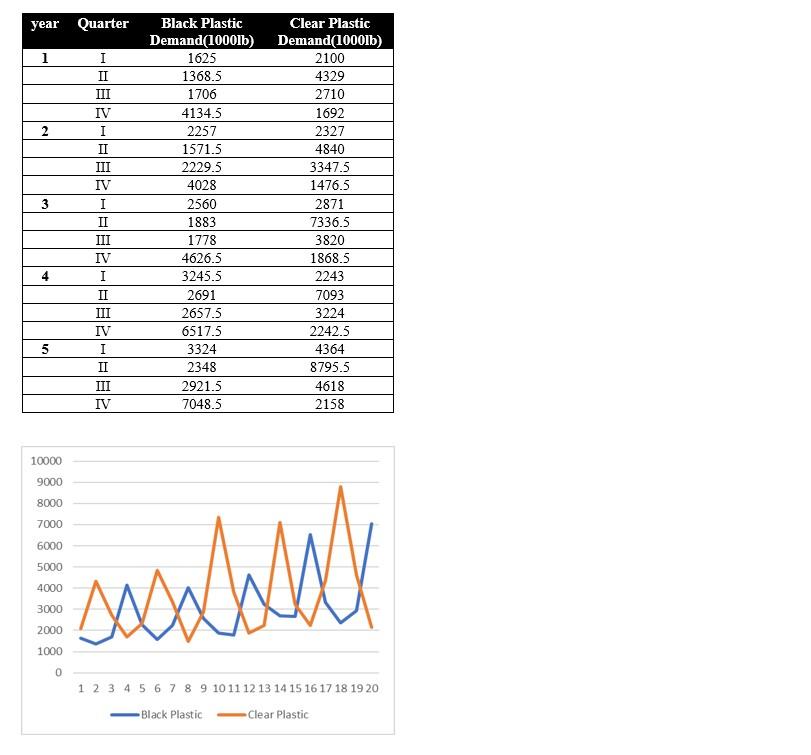
Over the past five years, the plastic packaging business has grown steadily. Demand for containers made from clear plastic comes from grocery stores, bakeries, and restaurants. Demand for black plastic trays comes from caterers and grocery stores who use them as packaging and serving trays. Demand for clear plastic containers peaks in the summer months, whereas demand for black plastic containers peaks in the fall. Capacity on the extruders is not sufficient to cover demand for sheets during the peak seasons. As a result, the plant is forced to build inventory of each type of sheet in anticipation of future demand. Table (b) and Figure(c) display historical quarterly demand for each of the two types (clear and black) of containers. This demand data was modified from ABCs sales data by the team to take into account the lost sales when ABC was out of stock. Without the customers involved in this team, ABC would never have known this information as they did not keep track of lost orders.
Questions
As a first step in the teams decision making, they want to forecast quarterly demand for each of the two types of containers for the years 6 to 8. Based on historical trends, demand is expected to continue to grow until year 8, after which it is expected to plateau. Jilly must select the appropriate forecasting method and estimate the likely forecast error.
Step by Step Solution
There are 3 Steps involved in it

Get step-by-step solutions from verified subject matter experts