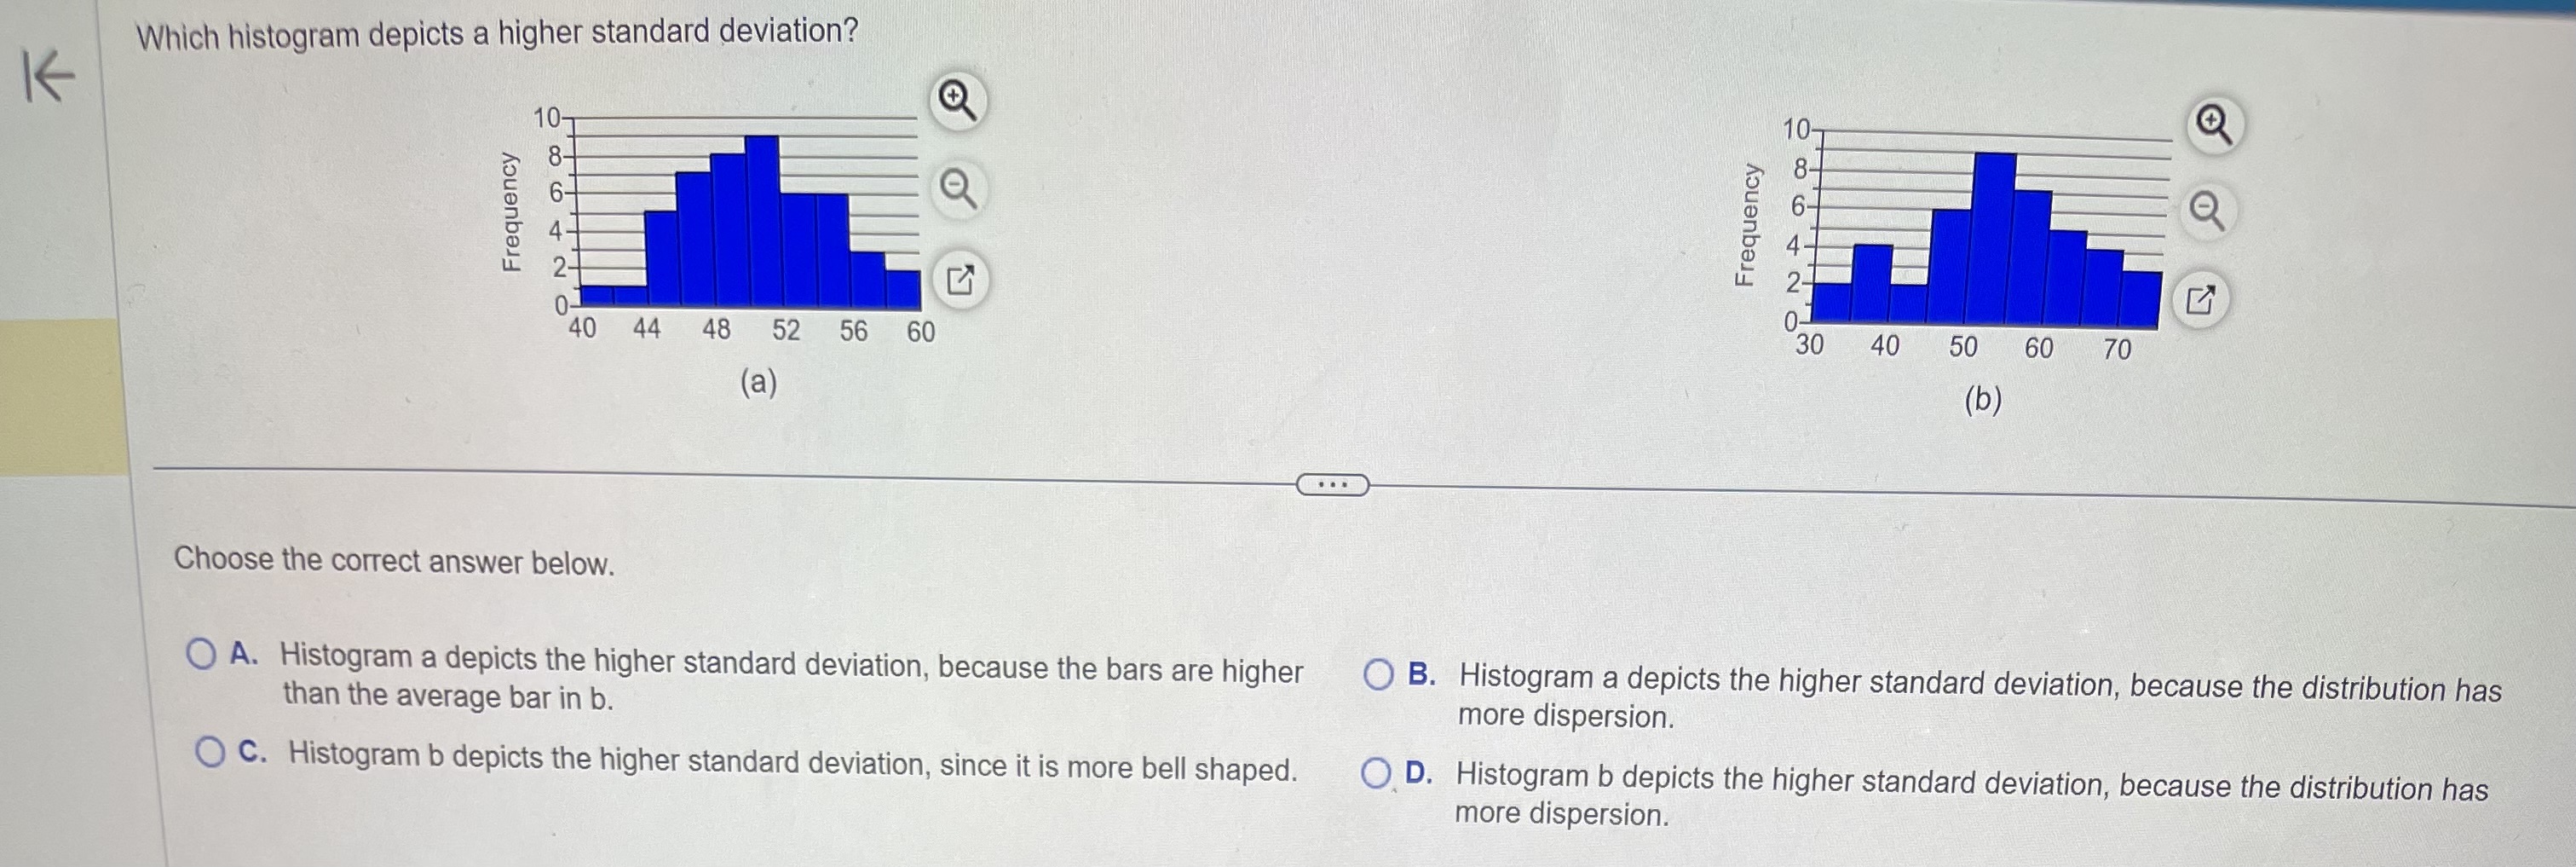
Question: Which histogram depicts a higher standard deviation? K 10- Frequency Frequency NPC 0- 40 44 48 52 56 60 30 40 50 60 70 (a)

Which histogram depicts a higher standardWhich histogram depicts a higher standardWhich histogram depicts a higher standardWhich histogram depicts a higher standardWhich histogram depicts a higher standardWhich histogram depicts a higher standard
Which histogram depicts a higher standard deviation? K 10- Frequency Frequency NPC 0- 40 44 48 52 56 60 30 40 50 60 70 (a) (b) Choose the correct answer below. O A. Histogram a depicts the higher standard deviation, because the bars are higher O B. Histogram a depicts the higher standard deviation, because the distribution has than the average bar in b. more dispersion. O C. Histogram b depicts the higher standard deviation, since it is more bell shaped. O. D. Histogram b depicts the higher standard deviation, because the distribution has more dispersion.The accompanying data represent the pulse rates (beats per minute) of nine students enrolled in a statistics course. Treat the nine students as a population. Complete parts (a) K through (c). Click the icon to view the data on the students' pulse rates. (a) Compute the population standard deviation. 6= beats per minute (Round to one decimal place as needed.)At one point the average price of regular unleaded gasoline was $3.35 per gallon. Assume that the standard deviation price per gallon is $0.09 per gallon and use Chebyshev's inequality to answer the following. (a) What percentage of gasoline stations had prices within 4 standard deviations of the mean? (b) What percentage of gasoline stations had prices within 1.5 standard deviations of the mean? What are the gasoline prices that are within 1.5 standard deviations of the mean? (c) What is the minimum percentage of gasoline stations that had prices between $3.08 and $3.62? . . . (a) At least |% of gasoline stations had prices within 4 standard deviations of the mean. (Round to two decimal places as needed.)The following data represent the pulse rates (beats per minute) of nine students enrolled (a) Determine the population mean pulse. in a statistics course. Treat the nine students as a population. Complete parts (a) to (c). The population mean pulse is approximately |beats per minute. Student Pulse Q (Type an integer or decimal rounded to the nearest tenth as needed.) Perpectual Bempah 78 Megan Brooks 69 Jeff Honeycutt 69 Clarice Jefferson 83 Crystal Kurtenbach 61 Janette Lantka 76 Kevin Mccarthy 76 Tammy Ohm 83 Kathy Wojdya 67Another measure of central tendency is the trimmed mean. It is computed by determining the mean of a data set after deleting the smallest and largest observed values. Compute the trimmed mean for the data given in the accompanying table. Is the trimmed mean resistant to changes in the extreme values in the given data? Click the icon to view the data table. The trimmed mean is . (Round to the nearest thousandth as needed.)A professor has recorded exam grades for 40 students in his class, but one of the grades is no longer readable. If the mean score on the exam was 82 and the mean of the 39 K readable scores is 84, what is the value of the unreadable score? The value of the unreadable score is

Step by Step Solution

There are 3 Steps involved in it

1 Expert Approved Answer
Step: 1 Unlock blur-text-image
Question Has Been Solved by an Expert!

Get step-by-step solutions from verified subject matter experts

Step: 2 Unlock
Step: 3 Unlock

Students Have Also Explored These Related Mathematics Questions!