

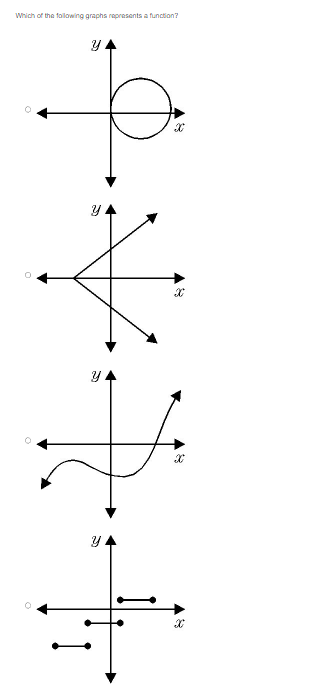
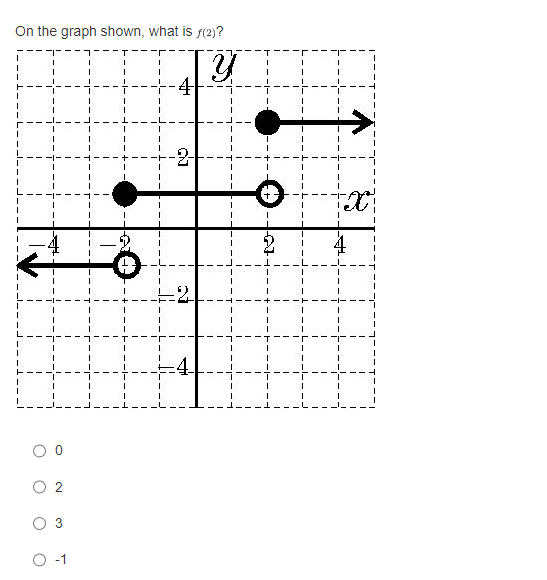
Question: Which of the following graphs represents a function? YA Y X Y X 4+ On the graph shown, what is (2)? Y 2 -1
![T -B -6-4-2 -5 x5 -8 f(x) 8 -f(x) [6] f(x) 2-8](https://dsd5zvtm8ll6.cloudfront.net/si.experts.images/questions/2024/02/65cdc7cf14c8a_84665cdc7cedbd2e.jpg)
Which of the following graphs represents a function? YA Y X Y X 4+ On the graph shown, what is (2)? Y 2 -1 T -B -6-4-2 -5 x5 -8 f(x) 8 -f(x) [6] f(x) 2-8 -8 f(a) 5 N The figure above shows the graph of function. What is the range of function ? 2 22 X
Step by Step Solution
There are 3 Steps involved in it
1 Expert Approved Answer
Step: 1 Unlock

Question Has Been Solved by an Expert!
Get step-by-step solutions from verified subject matter experts
Step: 2 Unlock
Step: 3 Unlock