

Which of the graphs in Figure 21-1 illustrates the nature of amixed cost? a.Graph 2 b.Graph 1
Fantastic news! We've Found the answer you've been seeking!
Question:
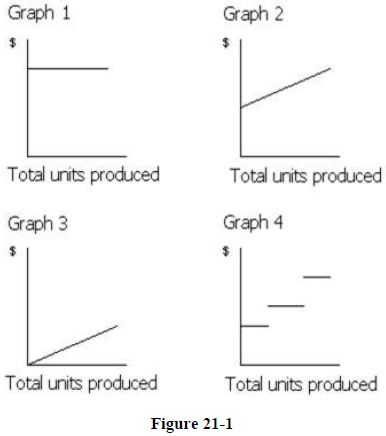
Which of the graphs in Figure 21-1 illustrates the nature of amixed cost?
a.Graph 2
b.Graph 1
c.Graph 4
d.Graph 3
Expert Answer:

Related Book For 
Posted Date:
