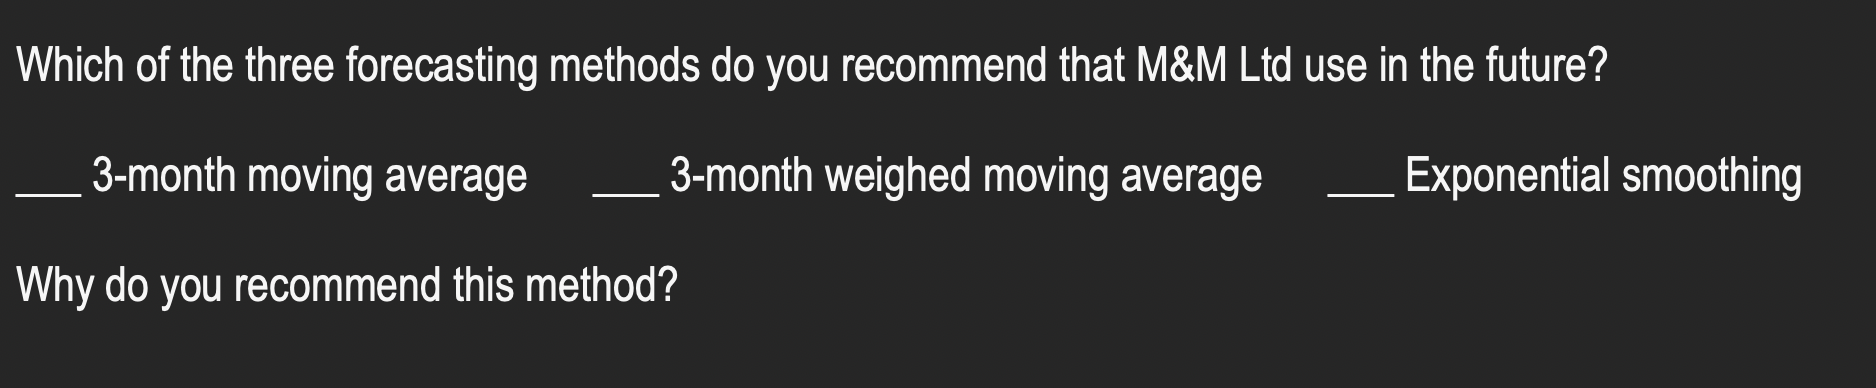
Question: Which of the three forecasting methods do you recommend that M&M Ltd use in the future? 3-month moving average 3-month weighed moving average Why do

Which of the three forecasting methods do you

Which of the three forecasting methods do you

Which of the three forecasting methods do you

Which of the three forecasting methods do you

Which of the three forecasting methods do you recommend that M&M Ltd use in the future? 3-month moving average 3-month weighed moving average Why do you recommend this method? Exponential smoothing A Month 1 2 Jan-20 3 Feb-20 4 Mar-20 5 Apr-20 6 May-20 7 Jun-20 8 Jul-20 9 Aug-20 10 Sep-20 11 Oct-20 12 Nov-20 13 Dec-20 14 Jan-21 15 Feb-21 16 Mar-21 17 Apr-21 18 19 Cumulative Forecast Error 20 Mean Forecast Error 21 Cumulative Absolute Deviation 22 Mean Absolute Deviation 23 Mean Absolute Percentage Error B Demand 15925 13201 13858 8631 9465 8991 8707 8352 12140 13448 8584 8968 11134 11059 14167 Forecast 14328.00 11896.67 10651.33 9029.00 9054.33 8683.33 9733.00 11313.33 11390.67 10333.33 9562.00 10387.00 12120 D Error -5697.00 -2431.67 -1660.33 -322.00 -702.33 3456.67 3715.00 -2729.33 -2422.67 800.67 1497.00 3780.00 -2716.00 -226.33 E Absolute Deviation 5697.00 2431.67 1660.33 322.00 702.33 3456.67 3715.00 2729.33 2422.67 800.67 1497.00 3780.00 29214.67 2434.56 F MAPE 66.01 25.69 18.47 3.70 8.41 28.47 27.62 31.80 27.01 7.19 13.54 26.68 23.72 A Month B Demand Jan-20 15925 Feb-20 13201 4 Mar-20 13858 5 Apr-20 8631 6 May-20 9465 7 Jun-20 8991 8 Jul-20 8707 9 Aug-20 8352 10 Sep-20 12140 11 Oct-20 13448 12 Nov-20 8584 13 Dec-20 8968 14 Jan-21 11134 15 Feb-21 11059 16 Mar-21 14167 17 Apr-21 18 19 Cumulative Forecast Error 20 Mean Forecast Error 21 Cumulative Absolute Deviation 22 Mean Absolute Deviation 23 Mean Absolute Percentage Error 2 3 Forecast 13834.75 10917.45 9612.40 9120.90 8882.20 8540.15 10470.90 12480.60 10642.00 9281.60 10120.90 10876.15 12775.90 D E Error Absolute Deviation -5203.75 5203.75 -1452.45 1452.45 -621.40 621.40 -413.90 413.90 -530.20 530.20 3599.85 3599.85 2977.10 2977.10 -3896.60 3896.60 -1674.00 1674.00 1852.40 1852.40 938.10 938.10 3290.85 3290.85 -1134.00 -94.50 26450.60 2204.22 F MAPE 60.29 15.35 6.91 4.75 6.35 29.65 22.14 45.39 18.67 16.64 8.48 23.23 21.49 A Month Jan-20 Feb-20 Mar-20 Apr-20 6 May-20 7 Jun-20 8 Jul-20 9 Aug-20 10 Sep-20 11 Oct-20 12 Nov-20 13 Dec-20 14 Jan-21 15 Feb-21 16 Mar-21 17 Apr-21 18 19 Cumulative Forecast Error 20 Mean Forecast Error 21 Cumulative Absolute Deviation 22 Mean Absolute Deviation 23 Mean Absolute Percentage Error 1 2 3 4 5 B Demand 15925 13201 13858 8631 9465 8991 8707 8352 12140 13448 8584 8968 11134 11059 14167 1.0 Forecast 13154 13717.20 9648.24 9501.65 9093.13 8784.23 8438.45 11399.69 13038.34 9474.87 9069.37 10721.07 10991.41 13531.88 D Error -5086.20 -183.24 -510.65 -386.13 -432.23 3701.55 2048.31 -4454.34 -506.87 2064.63 337.93 3175.59 -231.65 -19.30 E Absolute Deviation 5086.20 183.24 510.65 386.13 432.23 3701.55 2048.31 4454.34 506.87 2064.63 337.93 3175.59 22887.65 1907.30 LL F MAPE 58.93 1.94 5.68 4.43 5.18 30.49 15.23 51.89 5.65 18.54 3.06 22.42 18.62

Step by Step Solution

There are 3 Steps involved in it

1 Expert Approved Answer
Step: 1 Unlock blur-text-image
Question Has Been Solved by an Expert!

Get step-by-step solutions from verified subject matter experts

Step: 2 Unlock
Step: 3 Unlock

Students Have Also Explored These Related General Management Questions!