

Question: While on Casey's computer, you notice that a model for a recent experiment is completed. The model gives the temperature (7') as a function of
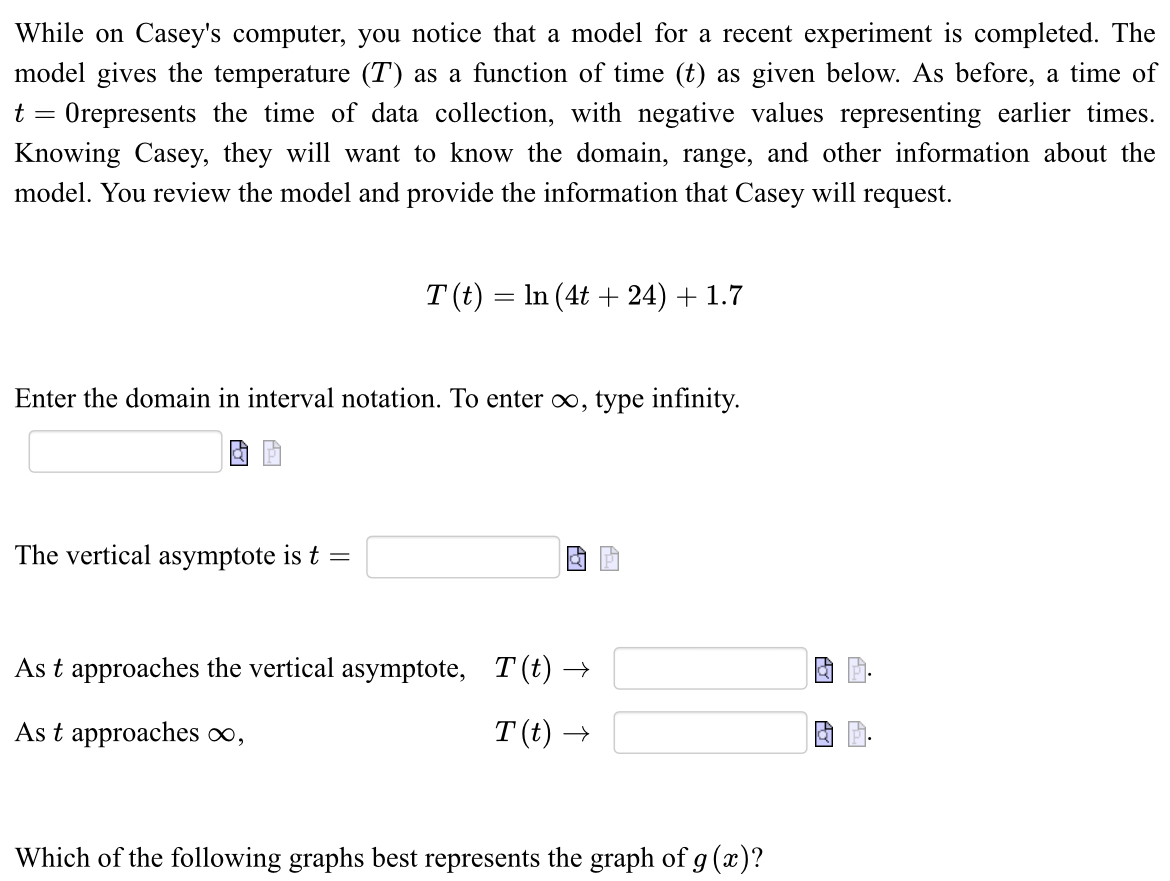
While on Casey's computer, you notice that a model for a recent experiment is completed. The model gives the temperature (7') as a function of time () as given below. As before, a time of t = Orepresents the time of data collection, with negative values representing earlier times. Knowing Casey, they will want to know the domain, range, and other information about the model. You review the model and provide the information that Casey will request. T(t) =In(4t + 24) + 1.7 Enter the domain in interval notation. To enter oo, type infinity. The vertical asymptote is t = & As t approaches the vertical asymptote, 7'(t) As t approaches oo, T(t) Which of the following graphs best represents the graph of g (z)
Step by Step Solution
There are 3 Steps involved in it

Get step-by-step solutions from verified subject matter experts