

Question: Why are the Control Limits varying and not displayed as straight, continuous lines across the P Chart shown here? 0.5- UCLE 0.4 Proportion D-0. 0.3
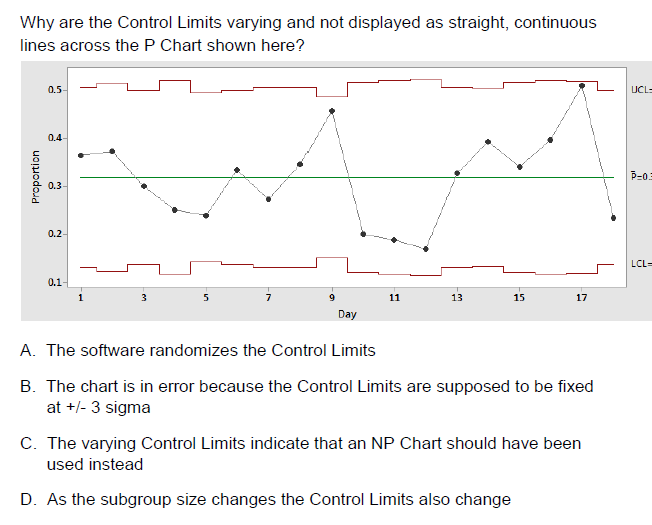
Why are the Control Limits varying and not displayed as straight, continuous lines across the P Chart shown here? 0.5- UCLE 0.4 Proportion D-0. 0.3 0.2 LCL 0.1- 1 3 5 7 9 11 13 15 17 Day A. The software randomizes the Control Limits B. The chart is in error because the Control Limits are supposed to be fixed at +/- 3 sigma C. The varying Control Limits indicate that an NP Chart should have been used instead D. As the subgroup size changes the Control Limits also change
Step by Step Solution
There are 3 Steps involved in it
1 Expert Approved Answer
Step: 1 Unlock

Question Has Been Solved by an Expert!
Get step-by-step solutions from verified subject matter experts
Step: 2 Unlock
Step: 3 Unlock