

Refer to Exercise 16.8, where the desired circuit path widths were .5 to .85 micron. The manufacturer
Question:
Refer to Exercise 16.8, where the desired circuit path widths were .5 to .85 micron. The manufacturer sampled four CPU chips six times a day (every 90 minutes from 8:00 A.M. until 4:30 P.M.) for five consecutive days. The path widths were measured and used to construct the MINITAB R-chart shown below.
a. Calculate the chart’s upper and lower control limits.
b. What does the R-chart suggest about the presence of special causes of variation during the time when the data were collected?
c. Should the control limit(s) be used to monitor future process output? Explain.
d. How many different R values are plotted on the control chart? Notice how most of the R values fall along three horizontal lines. What could cause such a pattern?
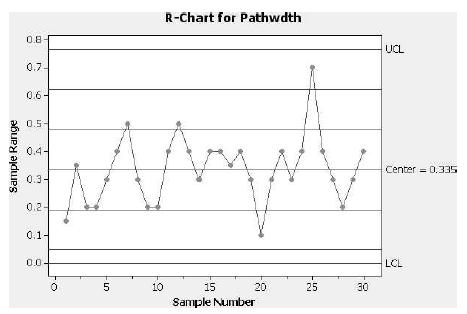
Data from Exercise 16.8
The central processing unit (CPU) of a microcomputer is a computer chip containing millions of transistors. Connecting the transistors are slender circuit paths only .5 to .85 micron wide. A manufacturer of CPU chips knows that if the circuit paths are not .5–.85 micron wide, a variety of problems will arise in the chips’ performance. The manufacturer sampled four CPU chips six times a day (every 90 minutes from 8:00 A.M. until 4:30 P.M.) for five consecutive days and measured the circuit path widths.
Step by Step Answer:


Statistics For Engineering And The Sciences
ISBN: 9781498728850
6th Edition
Authors: William M. Mendenhall, Terry L. Sincich
