

Question: Why following historical visualizations covered under graphical excellence impressed you the most? New York City's weather 2003 This chart shows 3,322 numbers Daily highs, lows,
Why following historical visualizations covered under graphical excellence impressed you the most?
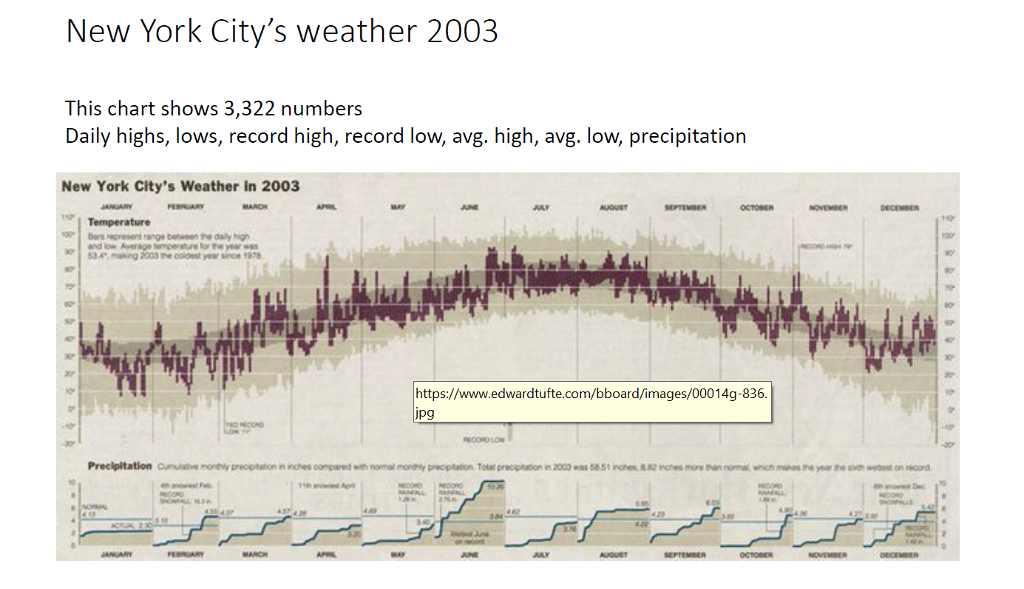
New York City's weather 2003 This chart shows 3,322 numbers Daily highs, lows, record high, record low, avg. high, avg. low, precipitation New York City's Weather in 2003 3making 2003 the coldest yer since 197 https://www.edwardtufte.com/bboard/images/00014g-836. pg
Step by Step Solution
There are 3 Steps involved in it
1 Expert Approved Answer
Step: 1 Unlock

Question Has Been Solved by an Expert!
Get step-by-step solutions from verified subject matter experts
Step: 2 Unlock
Step: 3 Unlock