

Question: Why might you use a pareto chart to represent data? A If you want to visualize how often data falls in certain intervals B
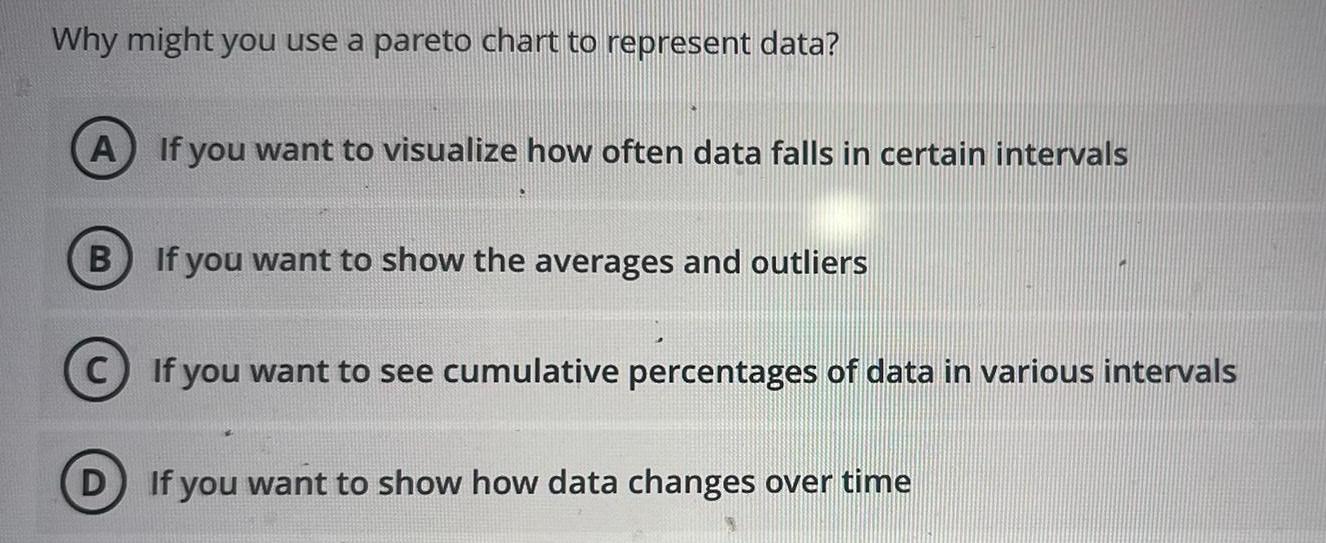
Why might you use a pareto chart to represent data? A If you want to visualize how often data falls in certain intervals B If you want to show the averages and outliers C If you want to see cumulative percentages of data in various intervals D) If you want to show how data changes over time
Step by Step Solution
There are 3 Steps involved in it
1 Expert Approved Answer
Step: 1 Unlock

Question Has Been Solved by an Expert!
Get step-by-step solutions from verified subject matter experts
Step: 2 Unlock
Step: 3 Unlock