

Question: why would my MAX be lower than National average? (National Average was given) AutoSave O OFF ~ H P ? . C ... MAT 240
why would my MAX be lower than National average? (National Average was given)
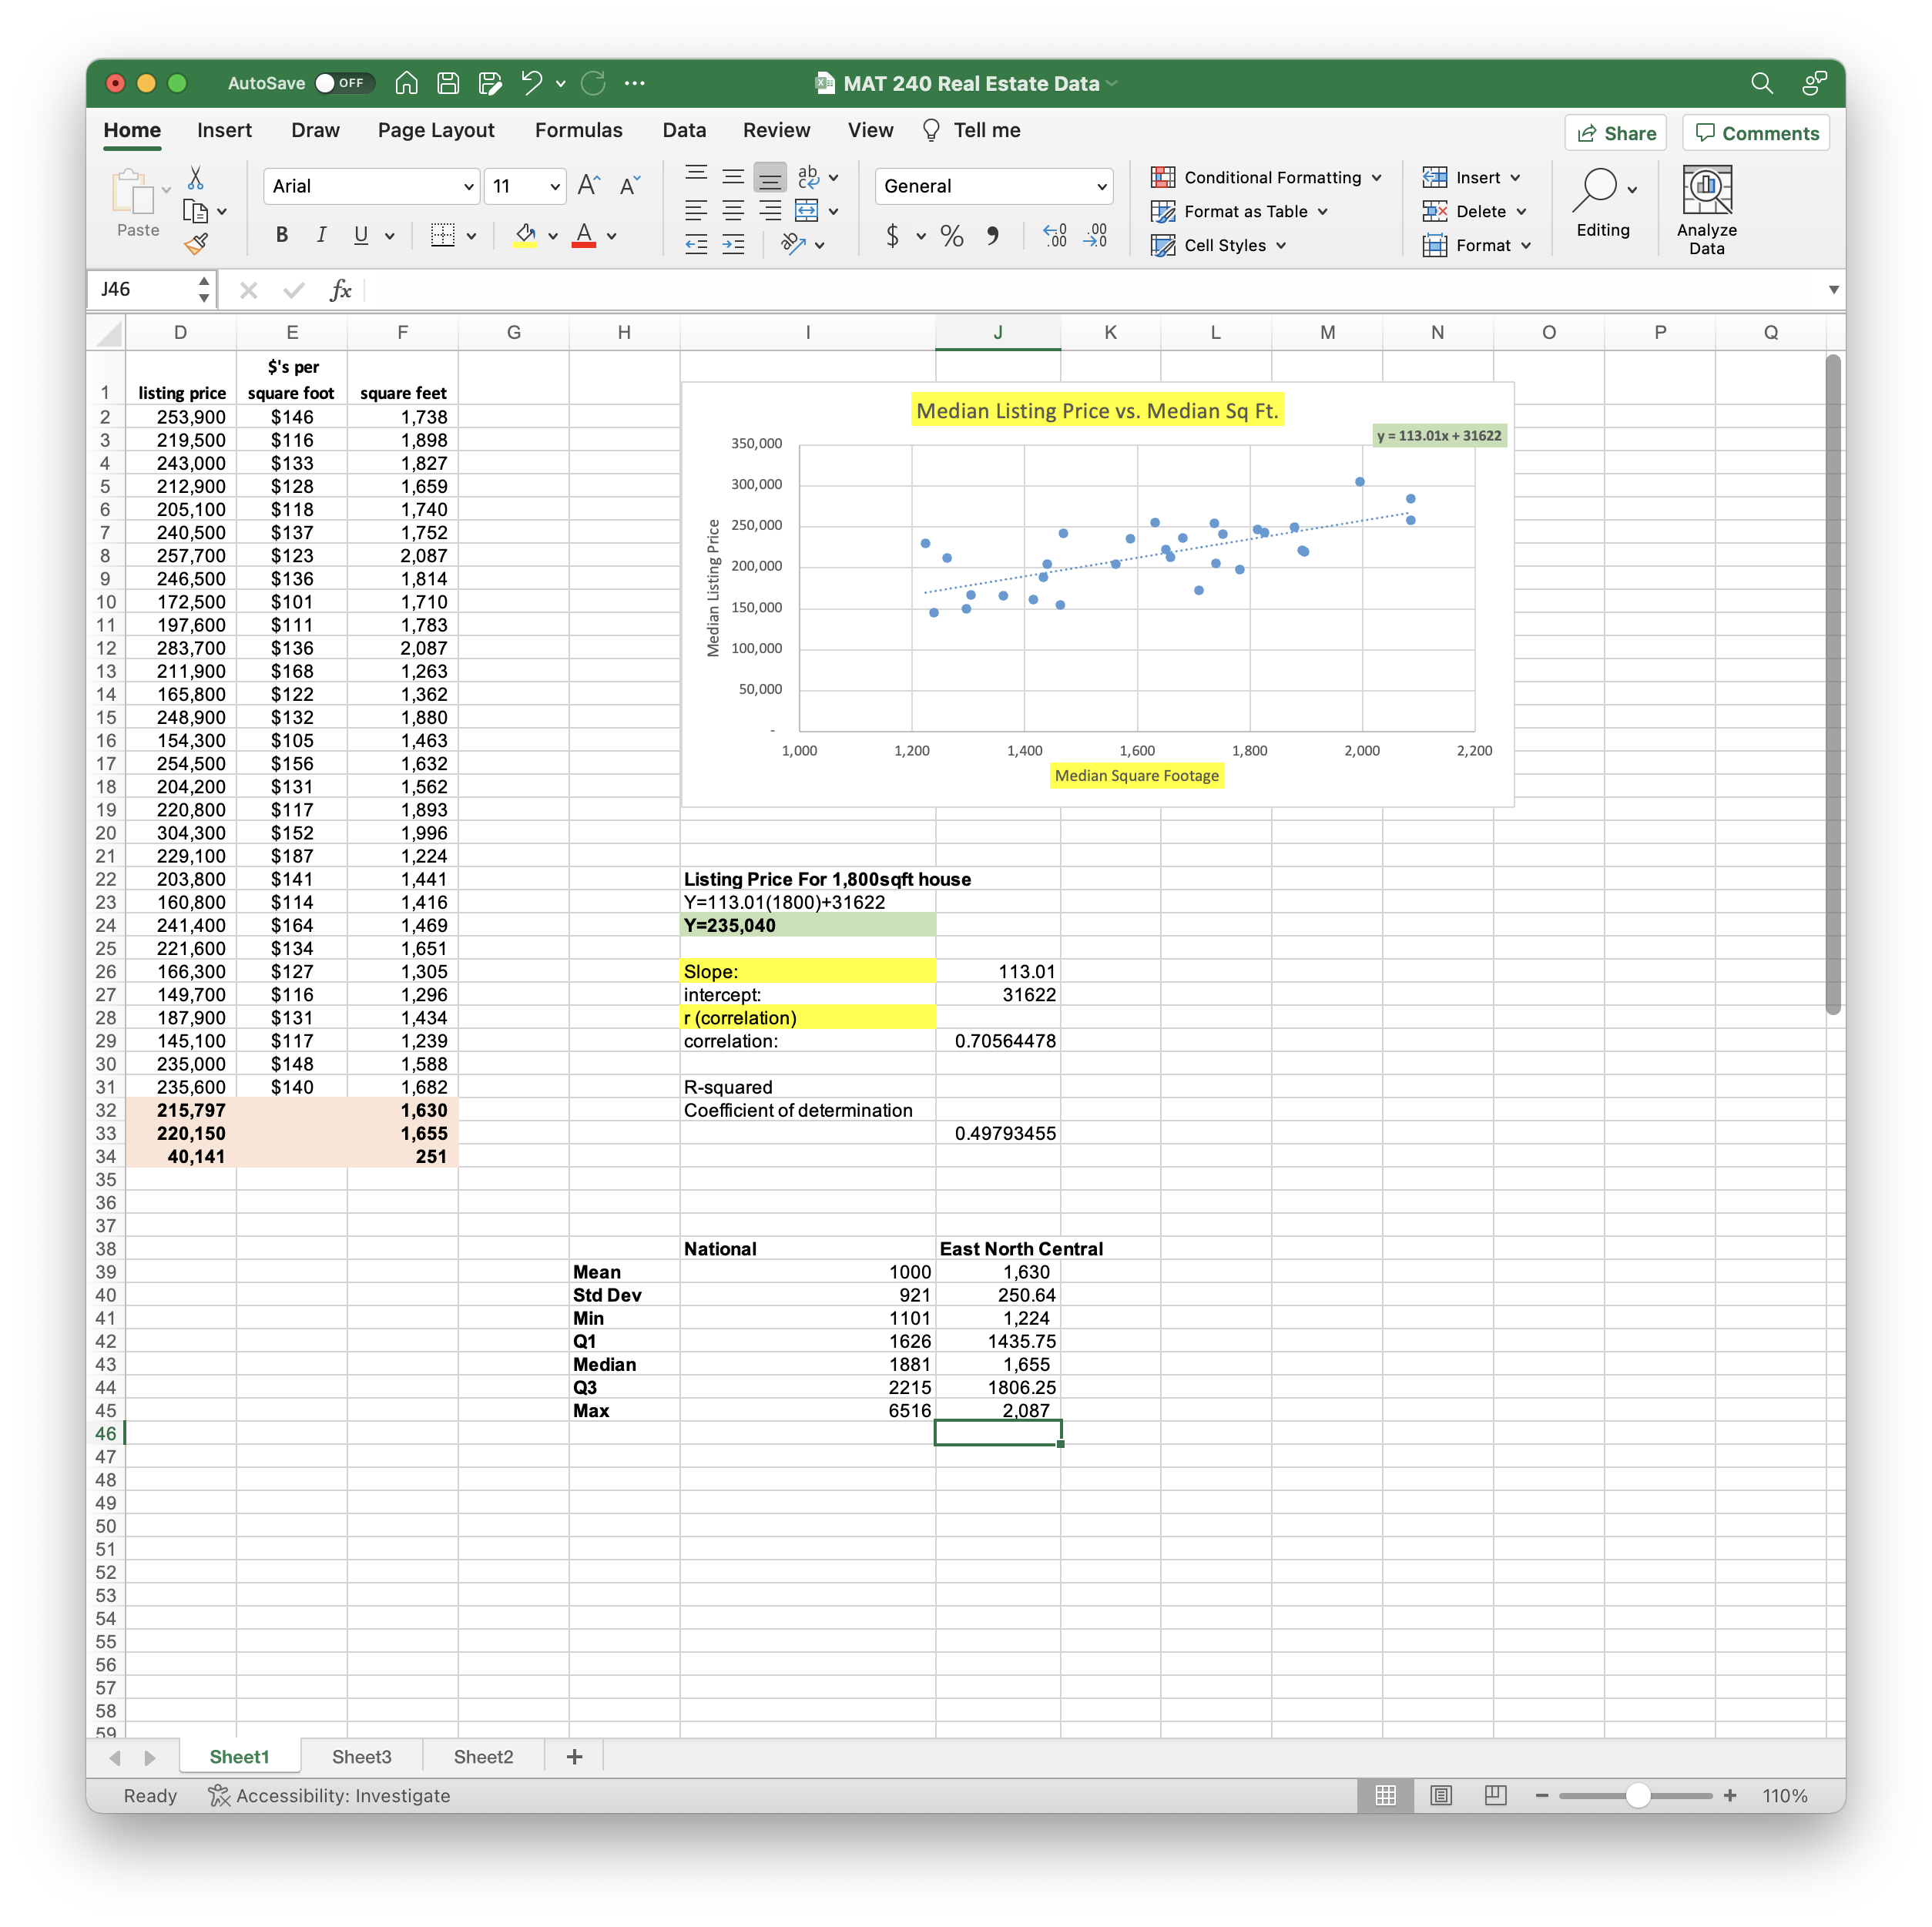
AutoSave O OFF ~ H P ? . C ... MAT 240 Real Estate Data Home Insert Draw Page Layout Formulas Data Review View ? Tell me Share Comments Aria 11 A A = General Conditional Formatting v Insert LAV Format as Table x Delete v Paste BIU BV LAV $ ~ % " Editing nalyze Cell Styles v Format Data J46 X V fx G H M N P Q $'s per listing price square foot square feet 253,900 $146 1,738 Median Listing Price vs. Median Sq Ft. 219,500 $116 1,898 350,000 y = 113.01x + 31622 243,000 $133 1.827 CO VOUTA WN - 212,90 $128 1,659 300,000 205,10 $118 1,740 .... 240,500 $137 1,752 250,000 257,700 $123 2,087 246,500 $136 1,814 2 200,000 72,500 $101 1,710 150,000 197,600 $111 1,783 283,700 $136 2,087 100,000 211,900 $168 1.263 14 165,800 $122 1.362 50,000 15 248,900 $132 1,880 154,300 $105 1,463 17 254,500 $156 1,632 1,000 1,200 1,400 1.600 1,800 2,000 2,200 18 204,200 $131 1,562 Median Square Footage 19 220,800 $117 1,893 304.300 $152 1.996 229,100 $187 1,224 203,800 $141 1,441 Listing Price For 1,800saft house 160,800 $114 .416 Y=113.01(1800)+31622 241,400 $164 ,469 Y =235,040 221,600 $134 1,651 166,300 $127 1,305 Slope: 113.01 149,700 $116 1,296 intercept: 31622 187,900 $131 145,100 $117 1,434 r (correlation) 1,239 correlation: 0.70564478 235,000 $148 1,588 235,600 $140 1.682 R-squared 15,797 1,630 Coefficient of determination 220,150 1.655 0.49793455 40,141 251 37 38 National East North Central 39 Mean 1000 1,630 40 Std Dev 92 250.64 41 Min 1101 1,224 42 Q1 1626 435.75 43 Median 1881 1,655 44 Q3 2215 45 Max 6516 2,087 46 47 1 48 49 50 51 52 53 54 55 56 57 58 59 Sheet1 Sheet3 Sheet2 + Ready Accessibility: Investigate -+ 110%
Step by Step Solution
There are 3 Steps involved in it

Get step-by-step solutions from verified subject matter experts