

Question: WILL RATE!! Please try not to use matplotlib, but if you do please make the code basic and as short as possible Let's point out:
 WILL RATE!! Please try not to use matplotlib, but if you do please make the code basic and as short as possible
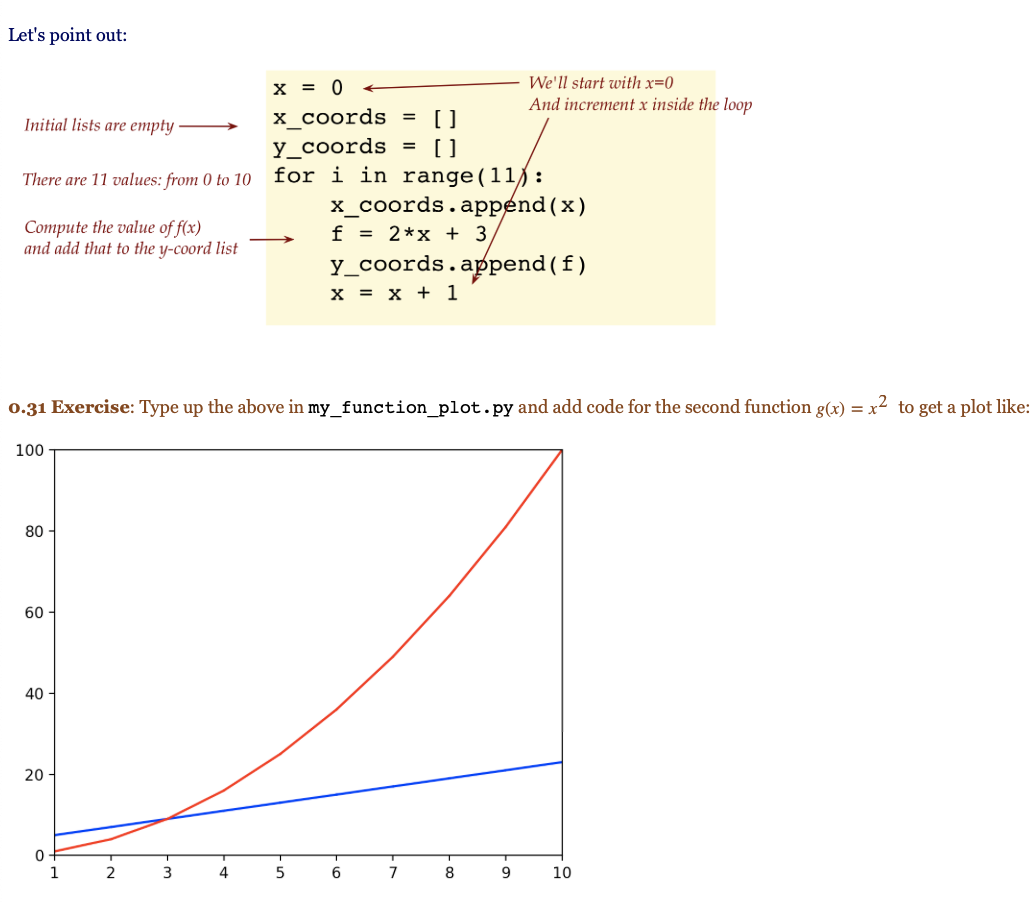
Let's point out: Initial lists are empty There are 11 values: from 0 to 10 x = 0 We'll start with x=0 And increment x inside the loop x_coords = [] y_coords = [ ] for i in range(11): x_coords.append(x) f = 2*x + 3 y_coords. append(f) x = x + 1 Compute the value of f(x) and add that to the y-coord list 0.31 Exercise: Type up the above in my_function_plot.py and add code for the second function g(x) = x2 to get a plot like: 100 80 60 40 20 0+ 1 2. 3 4 5 6 7 - 00 9 10
Step by Step Solution
There are 3 Steps involved in it
1 Expert Approved Answer
Step: 1 Unlock

Question Has Been Solved by an Expert!
Get step-by-step solutions from verified subject matter experts
Step: 2 Unlock
Step: 3 Unlock