

Question: WILL RATE VERY HIGHLY (PLUS I WILL TIP https://math.la.asu.edu/~tracogna/MAT343/LAB_VIDEOS/LAB_6/cauchybw.jpg Equations: Step 1. Download the file cauchybw.jpg and save it to your working MATLAB directory. Then
WILL RATE VERY HIGHLY (PLUS I WILL TIP
https://math.la.asu.edu/~tracogna/MAT343/LAB_VIDEOS/LAB_6/cauchybw.jpg
Equations:
Step 1. Download the file cauchybw.jpg and save it to your working MATLAB directory. Then load it into MATLAB with the command
A = imread(cauchybw.jpg); note the semicolon
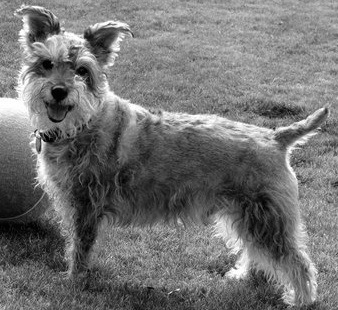
The semicolon is necessary so that MATLAB does not print out many screenfuls of data. The result is a matrix of grayscale values corresponding to a black and white picture of a dog. (The matrix has 104, 780 entries). Now, A is actually 3103383. To create an image from the matrix A, MATLAB uses the three values A(i, j, 1 : 3) as the RGB values to use to color the ijth pixel. We have a black and white picture so A(:,:,1) = A(:,:,2) = A(:,:,3) and we only need to work with A(:,:,1).
Step 2. We need to do some initial processing. Type
B = double(A(:,:,1)) + 1; dont forget the semicolon
which converts A into the double-precision format that is needed for the singular value decomposition. Now type
B = B/256; semicolon!
[U S V] = svd(B); semicolon!
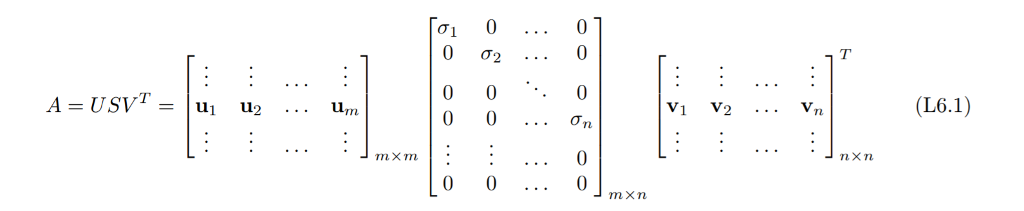
This decomposition is just Eq. (L6.1).
The gray scale goes from 0 to 256 in a black- and-white JPEG image. We divide B by 256 to obtain values between 0 and 1, which is required for MATLABs image routines, which we will use later.
PROBLEM 1. What are the dimensions of U, S, and V ? (Find out by typing size(U) - without the semicolon - and likewise for the others.)
Here S has more columns than rows; in fact, columns 311 to 338 are all zeros (When A has more columns than rows, we pad S on the right with zero columns to turn S into an m n matrix ). Otherwise, with this modification, the SVD is just like Eq. (L6.1).
PROBLEM 2. Compute the best rank-1 approximation to B and store it in the matrix rank1 (Use the commands given in the Example parts (a) and (b) on page 2, but applied to the matrix B, rather than A. Make sure you suppress the output ).
Step 3. Lets visualize rank1. To do that, first create
C = zeros(size(A)); semicolon!
This creates an array of zeros, C, of the same dimension as the original image matrix A
Step 4. Copy the rank-1 image into C as follows:
C(:,:,1) = rank1;
C(:,:,2) = rank1;
C(:,:,3) = rank1;
Include the code and the figure in your report.
Step 5: We are almost done, except for one hitch. MATLAB does all its scaling using values from 0 to 1 (and maps them to values between 0 and 256 for the graphics hardware). Lower-rank approximations to the actual image can have values that are slightly less than 0 and greater than 1. So we will truncate them to fit, as follows:
C = max(0,min(1,C));
Step 6. View the resulting image: image(C) no semicolon
PROBLEM 3. Create and view a rank-10 approximation to the original picture (Use Steps 4-6 but with rank10 instead of rank1. If you mess up - for example, you get an all-black picture - then start over from Step 3.) It is convenient to create an M-file with a for loop to evaluate 1u1v1^T + . . . + 10u10v10^T
Include the code and the figure.
Step by Step Solution
There are 3 Steps involved in it

Get step-by-step solutions from verified subject matter experts