

Question: With octave/matlab simulate and plot the Rossler system The Rssler system is a non-linear system that exhibits chaotic behaviour. The Rssler system is defined as
With octave/matlab simulate and plot the Rossler system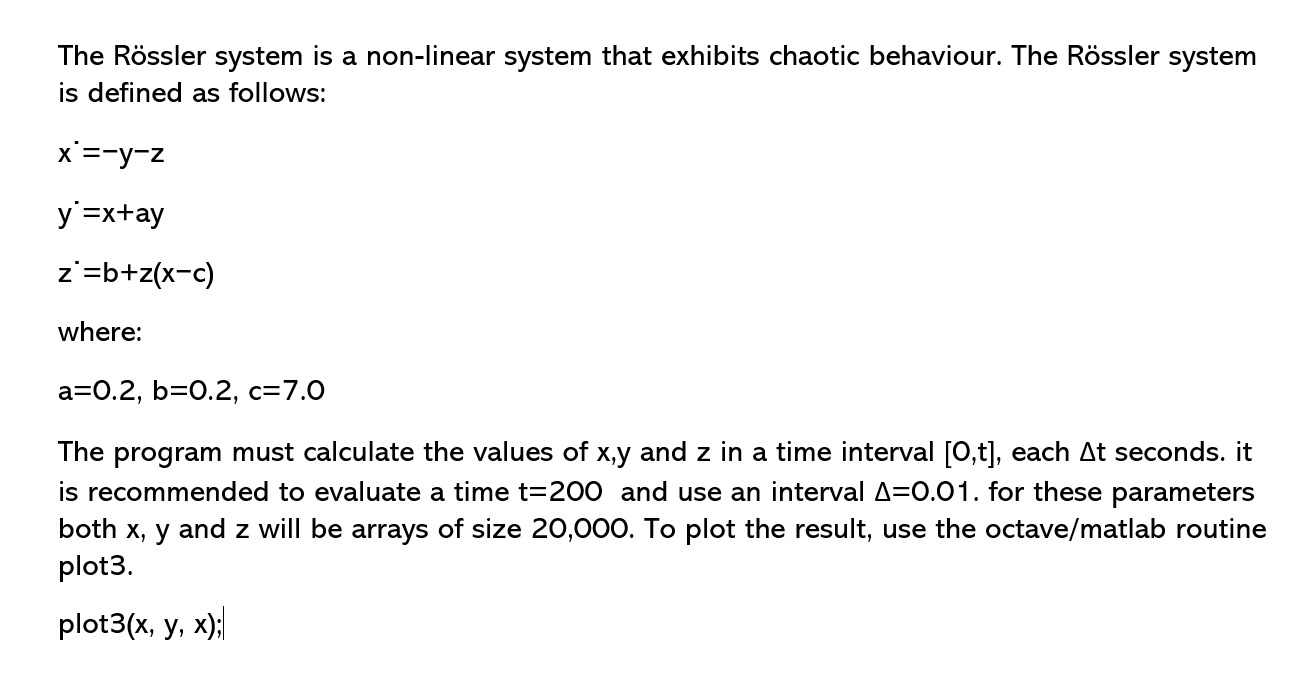
The Rssler system is a non-linear system that exhibits chaotic behaviour. The Rssler system is defined as follows: x=yzy=x+ayz=b+z(xc) where: a=0.2,b=0.2,c=7.0 The program must calculate the values of x,y and z in a time interval [0,t], each t seconds. it is recommended to evaluate a time t=200 and use an interval =0.01. for these parameters both x,y and z will be arrays of size 20,000 . To plot the result, use the octave/matlab routine plot3. plot3(x,y,x)
Step by Step Solution
There are 3 Steps involved in it
1 Expert Approved Answer
Step: 1 Unlock

Question Has Been Solved by an Expert!
Get step-by-step solutions from verified subject matter experts
Step: 2 Unlock
Step: 3 Unlock