

Question: ( 1 ) Frequency Response ( Bode Plots ) For your assigned circuit, plot the magnitude ( dB ) and phase of the frequency response
Frequency Response Bode Plots
For your assigned circuit, plot the magnitude dB and phase of the frequency response by four
different methods described below. You should end up with a total of eight graphs, six of which
are computer generated and two of which are handdrawn. In each case, make sure to use the
correct Bode plot format for the plots linear vertical axis, logarithmic horizontal axis. Comment
on any differences in the results.
The four methods are:
a Use the theoretical response you already calculated to plot the magnitude and phase
responses two separate plots You can use Matlab, or Excel if you are willing to take the
effort to force it to plot correctly. Remember that Excel always plots incorrectly if you do
not take action to choose the format and scales.
b Use circuit simulation Pspice LTSpice, or Cadence in AC Sweep mode to simulate
and plot the magnitude and phase responses two separate plots
c Use the theoretical response and then hand sketch the response using the rules for
"straight line" approximations to Bode amplitude and phase plots two separate plots
d Two separate plots of your measured results for amplitude and phase.
Transient Response
For your assigned circuit, plot the step response by three different methods. Comment on any
differences in the results. You should have three plots.
a Use the theoretical step response in combination with Matlab or Excel if you
prefer
b Use circuit simulation Pspice LTSpice, or Cadence in Transient mode to simulate the
step response.
c Show your recorded measurement scope shot for the step response.
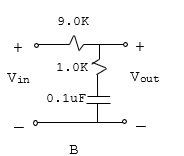
Circuit is attached
Step by Step Solution
There are 3 Steps involved in it
1 Expert Approved Answer
Step: 1 Unlock

Question Has Been Solved by an Expert!
Get step-by-step solutions from verified subject matter experts
Step: 2 Unlock
Step: 3 Unlock