Question: With the gasoline time series data from the given table, show the exponential smoothing forecasts using = 0.1. Applying the MSE measure of forecast accuracy,

With the gasoline time series data from the given table, show the exponential smoothing forecasts using = 0.1.

With the gasoline time series data from the given

Applying the MSE measure of forecast accuracy, would you prefer a smoothing constant of = 0.1 or = 0.2 for the gasoline sales time series?With the gasoline time series data from the given
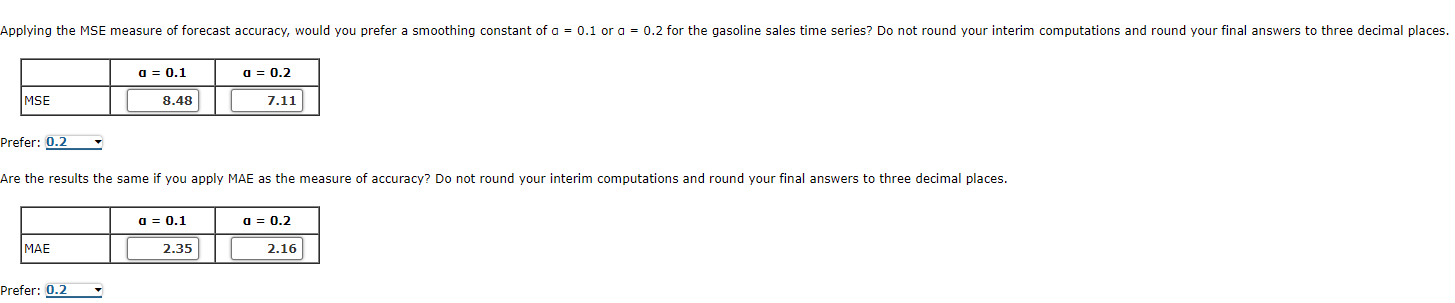
Please round answers three decimal places.

GASOLINE SALES TIME SERIES Week 1234 2 5 6 7 8 9 10 11 12 Sales (1000s of gallons) 17 21 19 23 18 16 20 18 22 20 15 22 Applying the MSE measure of forecast accuracy, would you prefer a smoothing constant of a = 0.1 or a = 0.2 for the gasoline sales time series? Do not round your interim computations and round your final answers to three decimal places. MSE Prefer: 0.2 MAE a = 0.1 Prefer: 0.2 8.48 Are the results the same if you apply MAE as the measure of accuracy? Do not round your interim computations and round your final answers to three decimal places. a = 0.1 a = 0.2 2.35 7.11 a = 0.2 2.16

Step by Step Solution

There are 3 Steps involved in it

1 Expert Approved Answer
Step: 1 Unlock blur-text-image
Question Has Been Solved by an Expert!

Get step-by-step solutions from verified subject matter experts

Step: 2 Unlock
Step: 3 Unlock

Students Have Also Explored These Related General Management Questions!